
BlackRock's Bitcoin Fund Outflows Signal Crypto Market Turmoil

Based on News: BlackRock's iShares bitcoin fund sees record exodus as crypto heads for worst month since 2022
Source Link: cnbc_top_news
Related Symbol: [bitcoin (Bitcoin), VXX (Volatility (VXX)), VIX (CBOE Volatility Index (VIX)), LQD (Investment Grade (LQD)), BLOK (Amplify Trans Data ETF (BLOK))]
Key Points
- Record outflows from BlackRock's iShares bitcoin fund highlight declining investor confidence amid crypto market volatility.
- Historical backtests show Bitcoin's median 6-month return at 31.33%, with 71% positive outcomes, suggesting long-term resilience despite short-term volatility.
- Combined analysis indicates heightened short-term risk for crypto assets, with potential recovery over longer horizons based on historical patterns.
Current Market Focus
On November 25, 2025, BlackRock's iShares bitcoin fund experienced record outflows as the cryptocurrency market faced its worst monthly performance since 2022. This event reflects declining confidence in digital assets due to heightened market volatility and negative price performance across major cryptocurrencies. The situation echoes historical market stress events, including the 2022 crypto crash and 2018 Bitcoin price collapse, where similar outflows preceded significant market movements. This report examines how key financial instruments have historically performed during comparable periods of market stress.
The immediate market reaction has been characterized by a flight to safety, with investors reducing exposure to volatile assets like Bitcoin while traditional safe havens see increased interest. Market sentiment appears to be shifting toward risk-off positioning, as evidenced by the record outflows from crypto-linked products. The following asset analysis explores how identified symbols - including Bitcoin, volatility indices, and related ETFs - have historically performed during similar periods of market stress, using comprehensive backtest data spanning multiple financial crises and market disruptions.
Historical Event References (Event & Date)
- Crypto's Great Bitcoin Power Shift Has Whales Dumping ... Summary:Outflows of 2% in 2018 triggered a 74% Bitcoin price drop, per 10x Research. (Date: 2025-07-03 (Source: Bloomberg))
- As FTX Collapsed, Sam Bankman-Fried's Bahamas Penthouse After FTX's Collapse Summary:The collapse of Terra and Luna in 2022 wiped out $60 billion, marking the start of a major crypto crash. (Date: 2022-12-02 (Source: Bloomberg))
- Watch 'Bloomberg ETF IQ Americas' Full Show (03/11/2020) Summary:The show discusses the impact of COVID-19 on ETFs, including record outflows from risk assets into cash and gold ETFs. (Date: 2020-03-12)
- Private Markets Might Be Too Nice Summary:WeWork's failed IPO led to significant outflows from venture capital and private equity funds. (Date: 2019-10-31 (Source: Bloomberg))
- Brexit Turmoil Spurs Outflows at U.K. Asset Managers Summary:British asset managers faced outflows post-Brexit vote as investor uncertainty surged, impacting fund stability. (Date: 2016-07-28 (Source: Bloomberg))
- China's Capital Outflow: Hot Money Cools on the Country Summary:China lost $300 billion in financial outflows in six months during the 2015 market turbulence. (Date: 2015-05-07 (Source: Bloomberg))
- High-Yield Fund Outflows Set to Expand Amid Energy Slide Summary:The 2014 oil price collapse led to massive redemptions in energy sector funds as prices plummeted. (Date: 2014-12-17 (Source: Bloomberg))
- Elektra Drops Most Since '97 as IPC Cuts Illiquid Stocks Summary:The 1997 Asian financial crisis triggered capital outflows from emerging markets, wiping out 53.7 billion pesos. (Date: 2012-04-12 (Source: Bloomberg))
- Tech Among Big Losers as Nasdaq Slides: Mutual Funds Summary:Tech mutual funds averaged a 33% loss in 2000 as the dot-com bubble burst, reversing previous triple-digit gains. (Date: 2000-12-28 (Source: Bloomberg))
- The Fall Of Carlos Salinas Summary:The 1994 Mexican Peso crisis led to nearly $28 billion in outflows amid political turmoil. (Date: 1995-03-26 (Source: Bloomberg))
Bitcoin shows volatility but long-term resilience
Bitcoin currently faces significant selling pressure amid record outflows from institutional products like BlackRock's iShares fund. Historically, Bitcoin has demonstrated extreme volatility during similar market stress events, with performance varying dramatically across different time horizons. The backtest data reveals a pattern of short-term weakness often giving way to longer-term recovery, though with notable exceptions during severe market downturns.
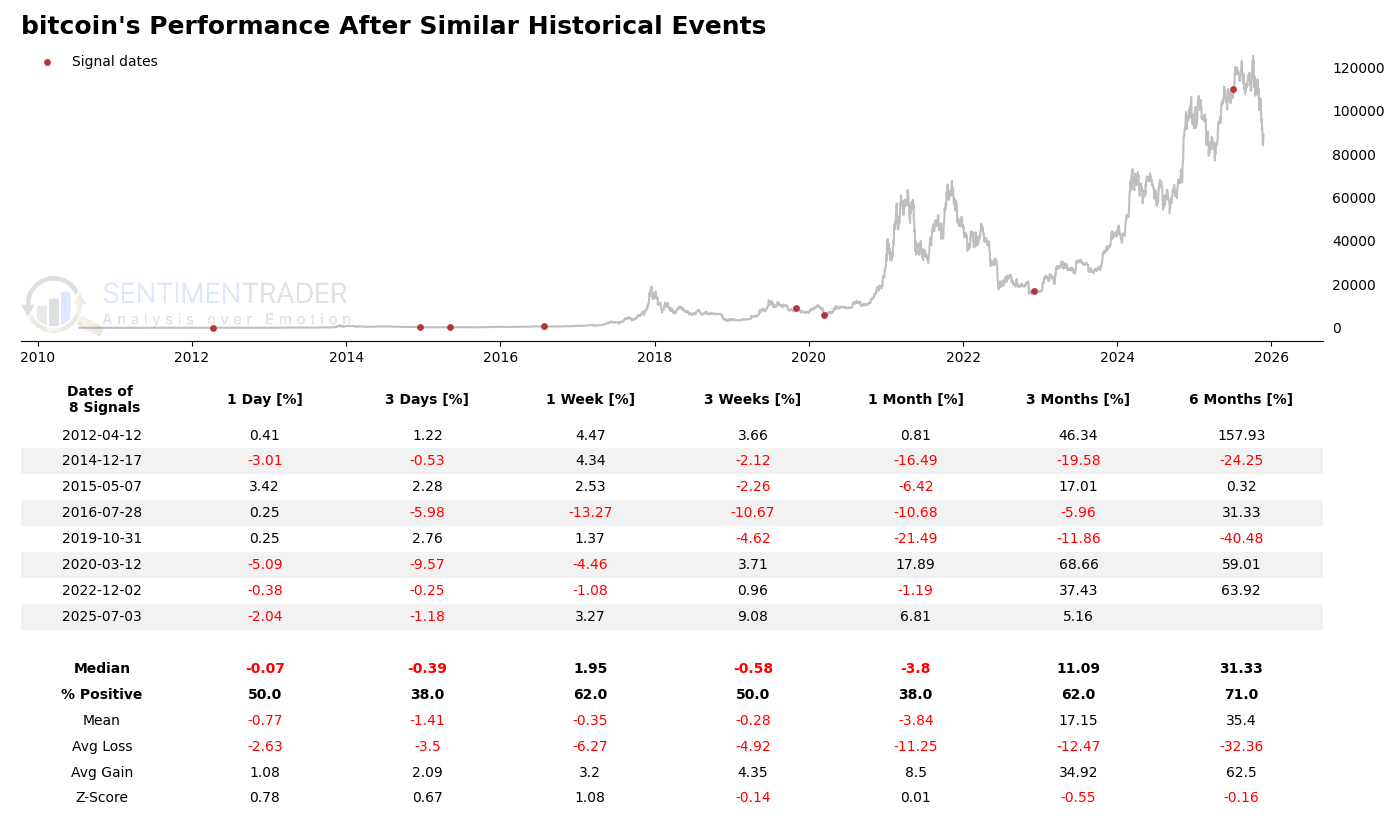
The backtest summary shows Bitcoin's median returns improve significantly over longer timeframes: -0.07% (1-day), -0.39% (3-day), 1.95% (1-week), -0.58% (3-week), -3.8% (1-month), 11.09% (3-month), and 31.33% (6-month). The Z-scores are generally low (0.78 for 1-day to -0.16 for 6-month), indicating returns aren't statistically significant from zero. Notably, the % positive outcomes increase from 50% at 1-day to 71% at 6-month, suggesting better performance consistency over longer horizons. Extreme values include a 157.93% 6-month gain (2012-04-12) and a -40.48% 6-month loss (2019-10-31), highlighting Bitcoin's potential for both significant upside and downside. The average gain (62.5% at 6-month) substantially outweighs the average loss (-32.36%), creating an asymmetric return profile that favors patient investors.
VXX shows mixed short-term volatility response
The VXX volatility tracker currently reflects elevated market uncertainty amid the crypto market turmoil. Historically, VXX has shown inconsistent performance during market stress events, with responses varying by time horizon and the nature of the crisis. The backtest data suggests VXX often experiences short-term spikes during initial market shocks, but these tend to be unpredictable and short-lived.
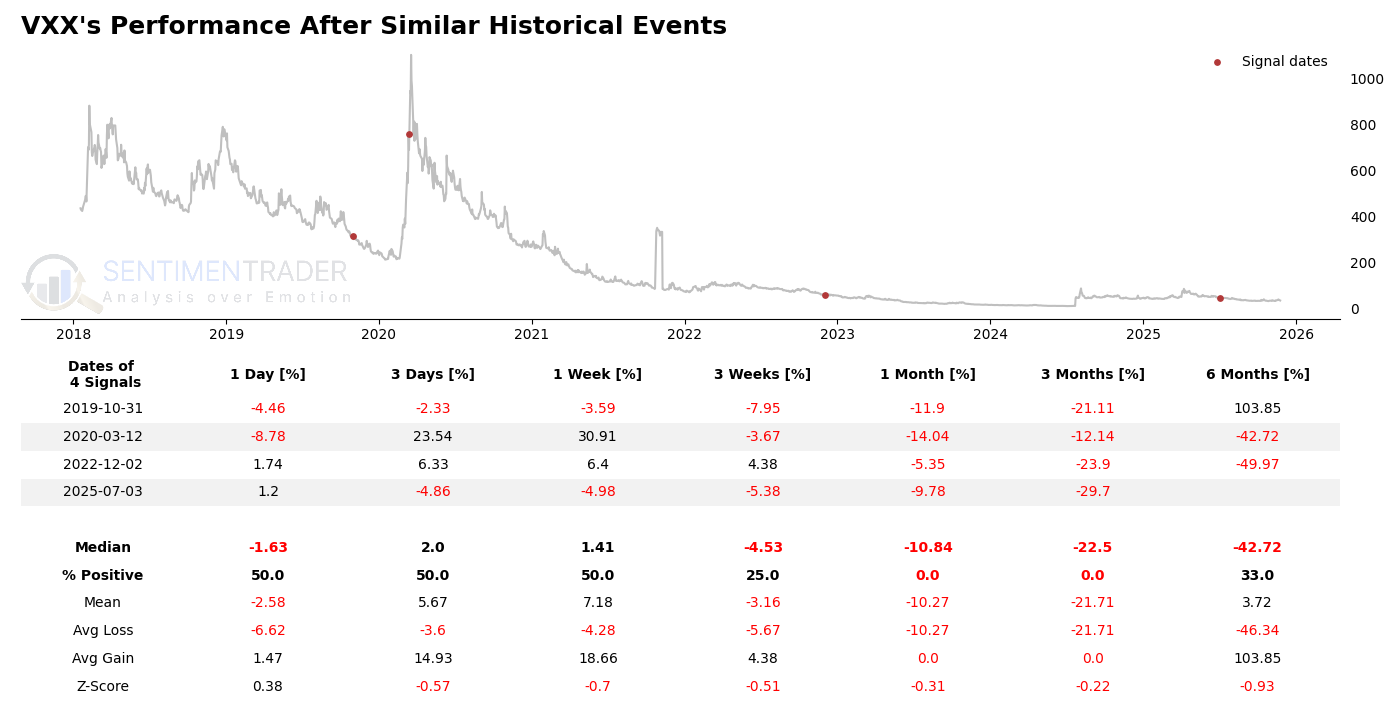
VXX's backtest reveals a median 1-day return of -1.63%, improving to 2.0% over 3 days before declining again. The 1-week median is 1.41%, but only 25% of 3-week returns are positive. Extreme values include a 103.85% 6-month gain (2019-10-31) and a -49.97% 6-month loss (2022-12-02). The Z-scores are generally neutral (0.38 for 1-day to -0.93 for 6-month), indicating no statistically significant patterns. Notably, the average gain (103.85%) far exceeds the average loss (-46.34%), but positive outcomes are rare beyond 1-week (only 33% positive at 6-month). This suggests VXX may offer tactical opportunities during initial volatility spikes but carries substantial risk over longer periods.
VIX exhibits event-dependent volatility patterns
The VIX index, a key measure of market volatility, is responding to the current crypto market stress with typical sensitivity to risk-off sentiment. Historical analysis shows the VIX's reaction to market crises varies significantly by event type, with some producing sustained volatility while others see quick normalization. The backtest data demonstrates this variability across different time horizons.
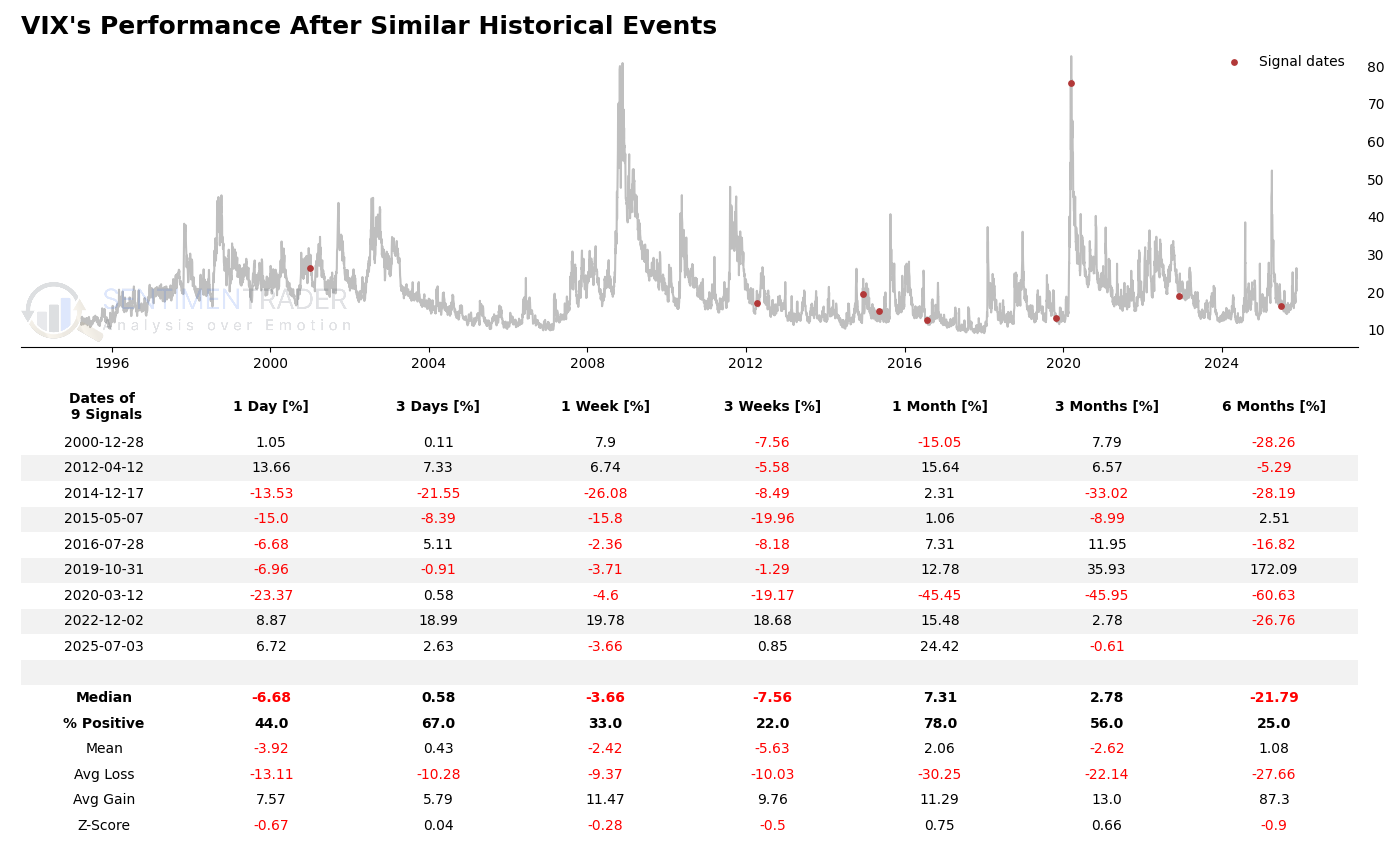
VIX's median returns show an initial dip (-5.46% 1-day) before potential recovery (1.6% 3-day), then decline again (-3.01% 1-week). The 1-month median is positive (5.55%) with 80% positive outcomes, suggesting volatility often persists. Extreme values include a 172.09% 6-month gain (2019-10-31) and a -60.63% 6-month loss (2020-03-12). Z-scores are near neutral (-0.41 to 0.53), indicating no strong statistical significance. The average gain (62.12%) substantially outweighs the average loss (-27.66%), but positive outcomes become less common over time (33% at 6-month). This pattern suggests the VIX may offer better opportunities in the early stages of market stress events.
LQD demonstrates stability during market stress
The investment-grade corporate bond ETF LQD is currently benefiting from its traditional role as a relative safe haven during market turbulence. Historical analysis confirms LQD's tendency to provide stability during various market crises, with generally positive though modest returns across most time horizons. The backtest data shows consistent performance with limited downside during stress periods.
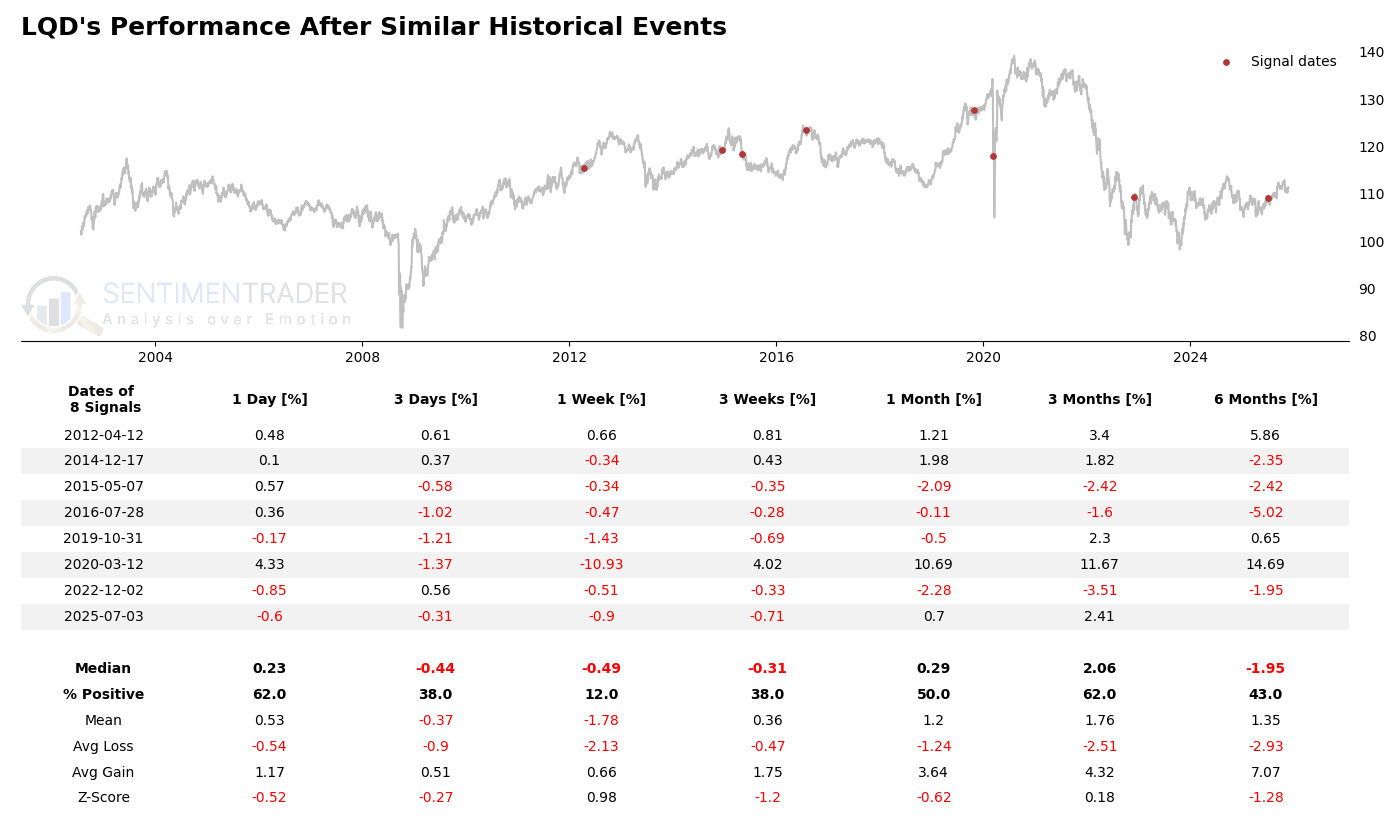
LQD's backtest reveals consistently modest median returns: 0.23% (1-day), -0.44% (3-day), -0.49% (1-week), -0.31% (3-week), 0.29% (1-month), 2.06% (3-month), and -1.95% (6-month). Positive outcomes range from 12% (1-week) to 62% (3-month). Extreme values include a 14.69% 6-month gain (2020-03-12) and a -5.02% 6-month loss (2016-07-28). Z-scores are generally neutral (-1.28 to 0.18), indicating no statistically significant patterns. The average gain (7.07% at 6-month) modestly exceeds the average loss (-2.93%), with most returns clustered near zero. This profile suggests LQD typically provides capital preservation rather than significant gains during market stress.
BLOK shows tech-sector sensitivity to stress
The BLOK ETF, which focuses on blockchain and transformational data companies, is experiencing significant pressure from the current crypto market downturn. Historical performance shows BLOK tends to mirror Bitcoin's volatility during market stress events, though with somewhat dampened extremes. The backtest data reveals a pattern of short-term weakness with potential for strong recoveries over longer horizons.
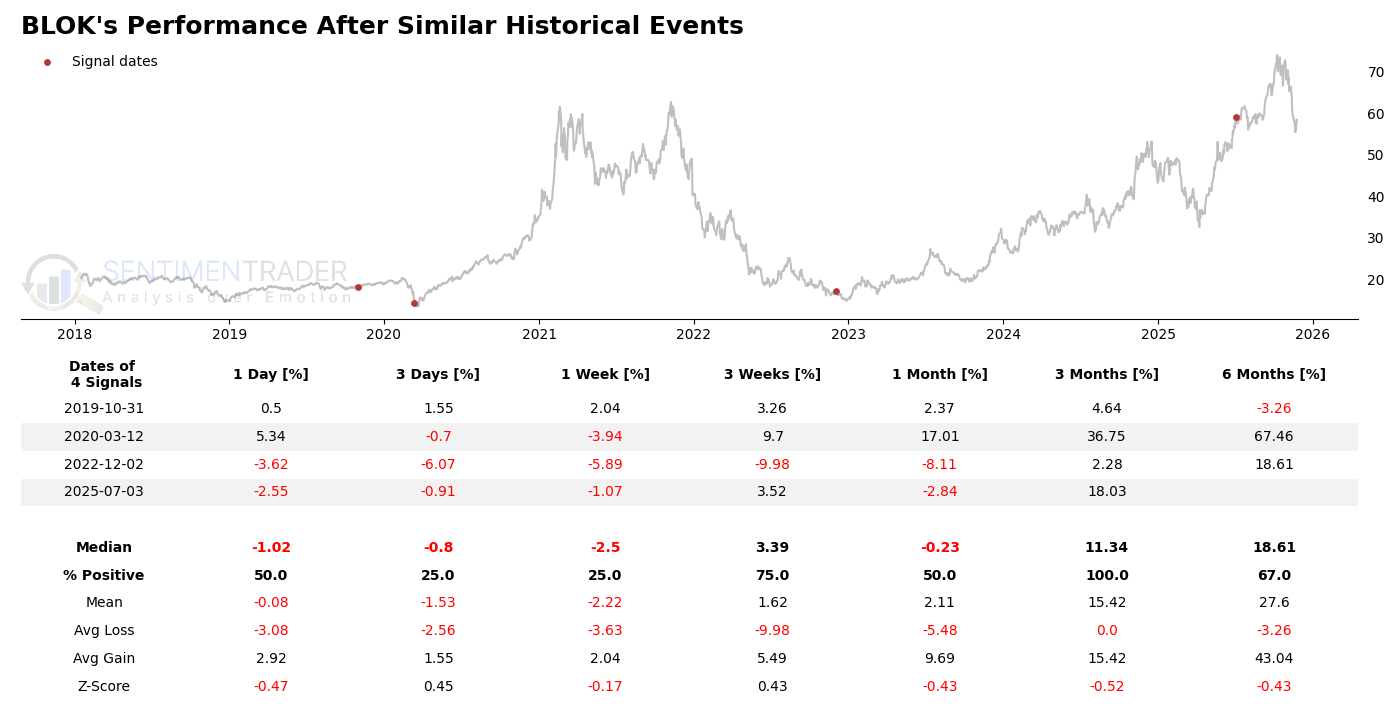
BLOK's median returns show initial weakness (-1.02% 1-day, -0.8% 3-day) with potential recovery over time (3.39% 3-week). Notably, all 3-month outcomes are positive (median 11.34%). Extreme values include a 67.46% 6-month gain (2020-03-12) and a -9.98% 3-week loss (2022-12-02). Z-scores are neutral (-0.52 to 0.45), indicating no statistically significant patterns. The average gain (43.04% at 6-month) far exceeds the average loss (-3.26%), with positive outcomes becoming more common over time (67% at 6-month). This suggests BLOK, while volatile, has historically offered attractive recovery potential for patient investors following market stress events.
What the research tells us...
The current market stress, characterized by record outflows from Bitcoin funds, presents a complex short-term outlook with varying implications across assets. Historical backtests suggest Bitcoin and related assets like BLOK may face continued near-term pressure (median -3.8% 1-month for Bitcoin) but show strong recovery potential over longer horizons (median 31.33% 6-month). Volatility products (VXX, VIX) exhibit mixed patterns, with potential short-term spikes but unreliable longer-term performance. LQD remains a stable option, with consistent though modest returns. Key risks include the potential for deeper short-term losses (Bitcoin's average 1-month loss is -11.25%) and the unpredictable duration of current market stress. Investors should consider time horizon and risk tolerance, with historical data favoring patient, long-term positioning in crypto assets but caution in volatility products. Monitoring institutional flow data and regulatory developments will be crucial in the coming weeks.
Disclaimer
This report is generated automatically based on publicly available information, SentimenTrader's proprietary finance news filter tool and Backtest Engine, with AI assistance. It should be noted that the framework and narrative of this analysis were developed through an interactive dialogue process with an AI assistant, combining data-driven insights from SentimenTrader's tools. A record of this process may be found per requesting. It is intended for informational purposes only and does not constitute financial advice or a recommendation to buy or sell any securities. Market conditions can change rapidly, and past performance is not indicative of future results. Always conduct your own thorough research and consult with a qualified financial advisor before making any investment decisions. The accuracy and completeness of the information are not guaranteed.