Products
SentimenTrader Trading Tools
‍
Backtest Engine
My Trading Toolkit
Correlation Analysis
Seasonality
Market Prediction
Indicators & Data API
‍
Proprietary Indicators & Charts
Market Data API
Strategies & Scanner
‍
50+ Trading Strategies
Smart Stock Scanner
Smart Option Scanner
Research Reports
‍
Research Solutions
Reports Library
Free Resources
Simple Backtest Calculator
Simple Seasonality Calculator
The Kelly Criterion Calculator
Sentiment Geo Map
Public Research Reports
Education
Sentiment Indicators
Technical Indicators
Pricing
Company
About
In the News
Testimonials
Client Success Stories
Contact
Log inLoginSign up
< BACK TO ALL REPORTS

Biotechnology triggers an optimism index buy signal

Dean Christians
2022-06-28
The Optimism Index reversed from a pessimistic level relative to its recent range, triggering a buy signal with an 84% win rate for the Biotechnology ETF (IBB).

Key points:

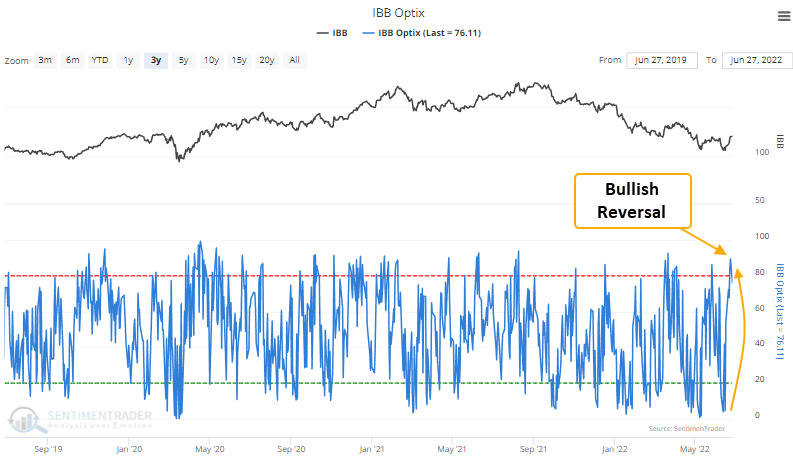
  • The Optimism Index for the Biotechnology ETF (IBB) reversed higher relative to its recent range
  • A trading model that uses the Optix Index triggered a new buy signal
  • The IBB ETF has rallied 84% of the time after other signals

Using the optimism index to identify bullish sentiment reversals

A trading model that uses the Optimism Index (Optix) to pinpoint when sentiment reverses from a period of pessimism issued a buy signal for the Biotechnology ETF (IBB) on 6/27/22. 

Jason and Jay published two notes this year that made a compelling long-term case for buying beaten-down biotechnology stocks. So, we can include an additional checkmark to the bullish ledger with the new Optix buy signal. Please click here and here to read their notes.

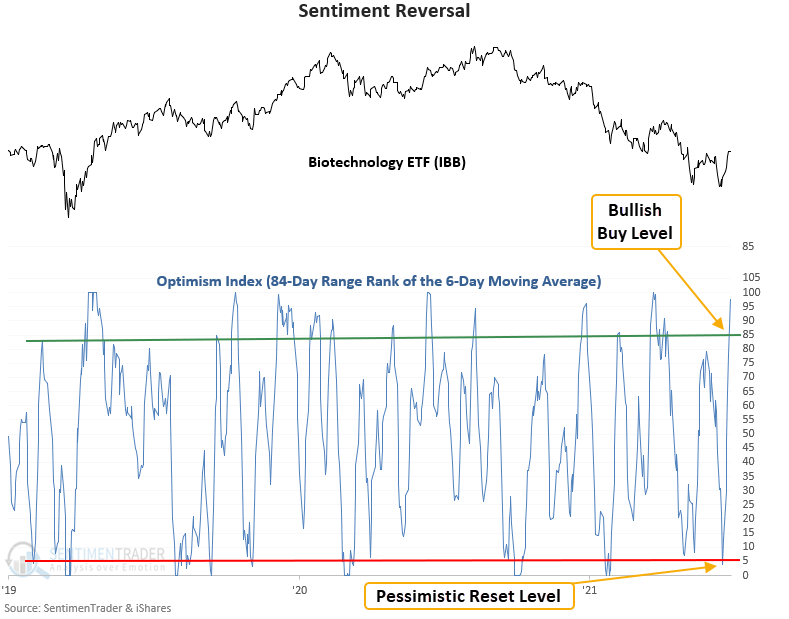
A trading model that identifies a reversal in the optimism index

The model applies an 84-day range rank to the 6-day moving average of the Optimism Index for the IBB ETF. The range rank indicator measures the current value relative to all other values over a lookback period. 100 is the highest, and 0 is the lowest. The pessimistic reset condition occurs when the range rank for the Optix Index crosses below the 5th percentile. A new buy signal triggers when the range rank exceeds the 85th percentile, and ETF momentum turns positive within 5 days of the cross. 

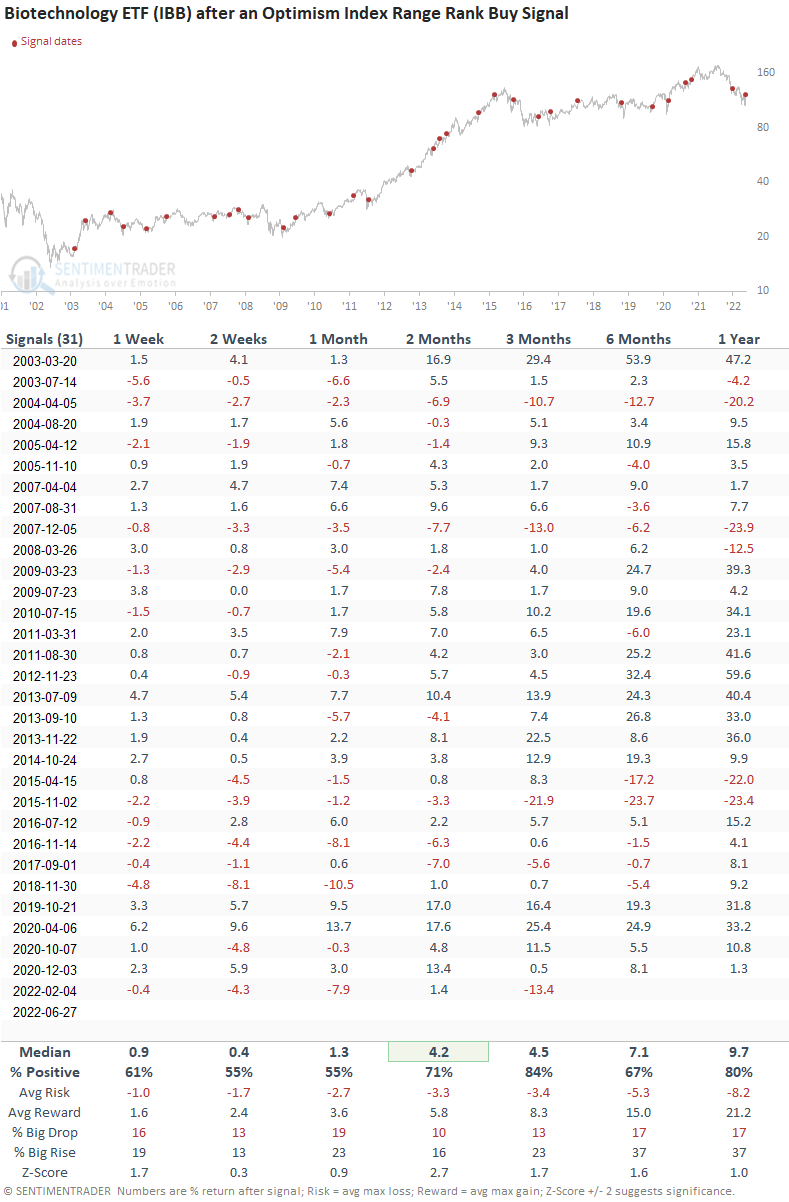
The Biotechnology ETF rallied 84% of the time after other signals

This model generated a signal 31 other times over the last 20 years. After the others, the IBB ETF future returns, win rates, and z-scores were solid across almost all time frames, especially the 2-month window. The model shows a positive return in 28 out of 31 instances at some point in the first three months. And one of the 28 winning signals was from an alert in February, which occurred in a challenging environment.

What the research tells us...

When the optimism index for the Biotechnology ETF (IBB) reverses from a pessimistic level, it signals that traders have become more optimistic about the future direction of biotechnology stocks. Using the Optix index to measure that change in sentiment, similar setups to what we're seeing now have preceded rising prices for the Biotechnology ETF (IBB), especially in the first 3 months. 

PRODUCTS
SentimenTrader
Trading Tools
Indicators & Data API
‍
Strategies & Scanner
‍
Research Reports
FREE
RESOUrCES
Simple Backtest
Calculator
Simple Seasonality
Calculator
The Kelly Criterion
Calculator
Sentiment Geo Map
‍
Public Research Reports
‍
Education
Sentiment Indicators
‍
Technical Indicators
‍
Pricing
Bundle pricing
‍
FAQ
‍
Announcements
‍
COMPANY
‍
About
‍
In the News
‍
Testimonials
‍
Client Success Stories
CONTACT
‍
General Inquiries
‍
Media Inquiries
‍
Financial Professionals Inquiries
‍
© 2026 Sundial Capital Research Inc. All rights reserved.
Setsail Marketing
TermsPrivacyAffiliate Program
Risk Disclosure: The information and tools provided are for research and analytical purposes only and are not intended as investment advice. Market analysis involves uncertainty, and outcomes may differ from expectations. Users should conduct their own due diligence and consider their individual circumstances before making any financial decisions. Past performance is not necessarily indicative of future results.

Hypothetical Performance Disclosure: Hypothetical performance results have many inherent limitations, some of which are described below. No representation is being made that any account will or is likely to achieve profits or losses similar to those shown; in fact, there are frequently sharp differences between hypothetical performance results and the actual results subsequently achieved by any particular trading program. One of the limitations of hypothetical performance results is that they are generally prepared with the benefit of hindsight. In addition, hypothetical trading does not involve financial risk, and no hypothetical trading record can completely account for the impact of financial risk of actual trading. for example, the ability to withstand losses or to adhere to a particular trading program in spite of trading losses are material points which can also adversely affect actual trading results. There are numerous other factors related to the markets in general or to the implementation of any specific trading program which cannot be fully accounted for in the preparation of hypothetical performance results and all which can adversely affect trading results.

Testimonial Disclosure: Testimonials appearing on this website may not be representative of other clients or customers and is not a guarantee of future performance or success.