
Biotech with options instead of shares

Key Points
- Dean's recent study suggests the potential for bullish follow-through in the biotech sector
- The stock replacement options strategy may offer a trader a lower-cost alternative to buying shares of XBI while retaining most of the potential benefits
Biotech oversold reversal signal
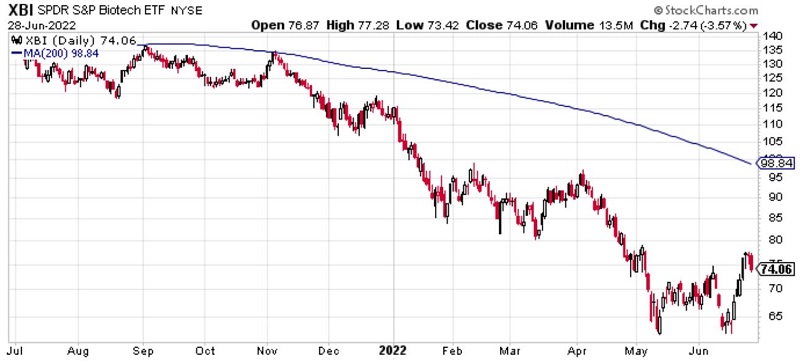
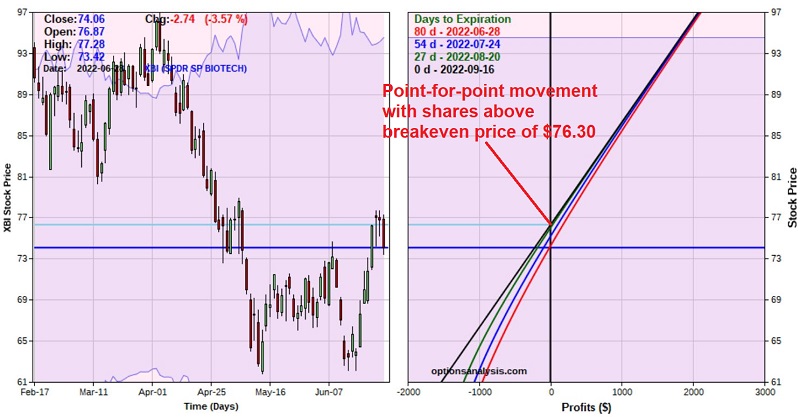
In this article dated 6/28/2022, Dean highlighted a potentially bullish signal for the biotech sector. In a nutshell, the history showed an 84% Win Rate for the three-month period, with a median % +(-) of +4.5%. This "oversold reversal" trade typically involves attempting to buy in early after a reversal. The chart below (courtesy of Stockcharts.com) illustrates the nature of this type of trading - often not for the faint of heart.
The most straightforward approach
A trader could buy 100 shares of ticker XBI (SPDR S&P Biotech ETF). XBI closed on 6/28 at $74.06 a share. So, to buy 100 shares would require a trader to commit $7,406, with an expected holding period of three months (or less, if an early profit is taken or a stop-loss trigger is hit). For example, a trader might decide at the entry to place:
- A profit target somewhere near resistance ($93-$97 a share)
- A stop-loss below the recent low of $61.78
- Taking a profit at $93 a share would result in a gain of +25.5%, while selling at $61.78 would result in a loss of -16.9%
Looking for a less costly alternative
XBI has September and October options available. The September options have 80 days left until expiration (i.e., less than the anticipated three-month holding period). However, the October call options had exactly zero trading volume. So, for this example, we will use the September options with the understanding that we will have less than three months to hold the trade (this is the type of subjective decision option traders must make from time to time).
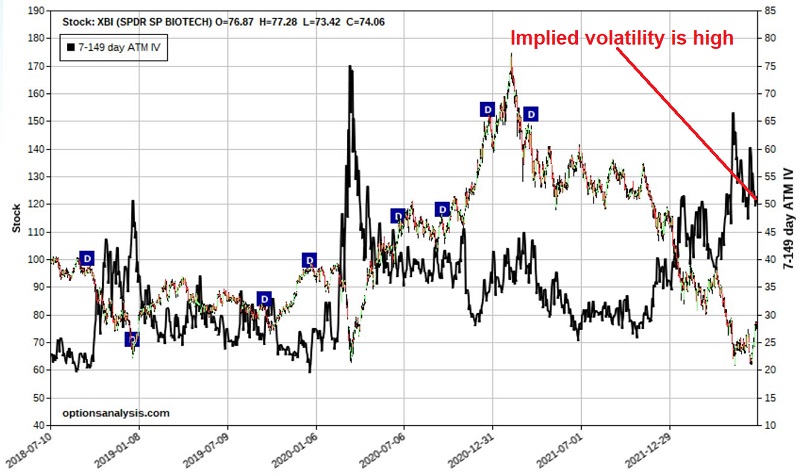
The biggest concern for entering a bullish XBI options trade is that "implied volatility" is toward the high end of the historical range. Why does this matter? Because implied volatility essentially tells you whether options are "expensive" or "cheap." More accurately, high IV tells us that there is more time premium built into the price of the options than usual (i.e., they are expensive), and low IV tells us that there is less time premium than usual (i.e., they are cheap). As you can see in the chart below (all charts and figures below are courtesy of Optionsanalysis), IV (dark black line) is towards the high end of the historical range.
Why does this matter? Let's assume a trader buys the at-the-money September 74 strike price call for $7.10. The implied volatility is roughly 50%.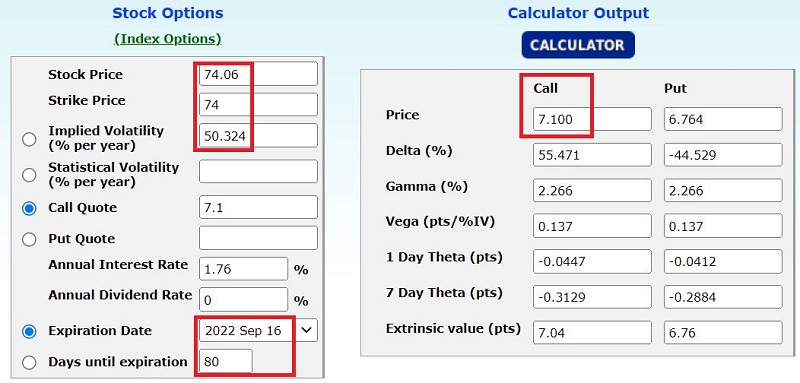
The price of this option is comprised almost entirely of time premium. As a result, changes in implied volatility can profoundly impact the price of the option. For illustration, let's assume that overnight IV dropped to 35% (not likely, but to illustrate the impact of changes in IV on the price of the option). As shown below, a 1-day drop in IV from 50% to 35% would result in a decline in the price of the option from $7.10 to $4.96.
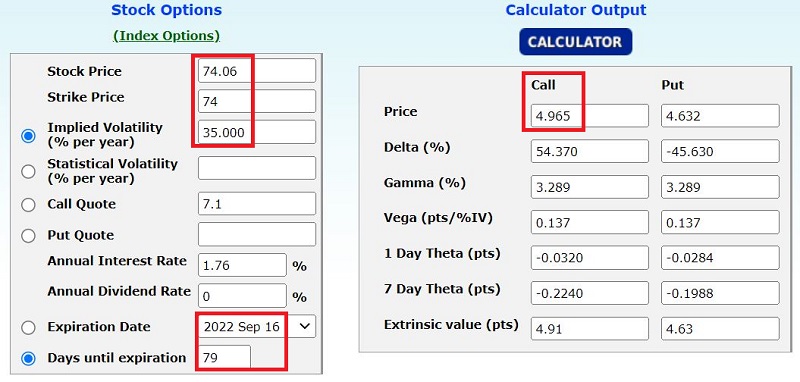
The bottom line: when IV is "high," it is essential to take steps to reduce the potentially very negative effect of a decline in IV.
The "Stock Replacement Strategy"
Various advanced options strategies involve selling premium to take advantage of high IV by selling "expensive" options. However, in this case, we assume that our hypothetical trader is simply looking for a less expensive alternative to buying 100 shares of XBI and is not looking to utilize any advanced options strategies.
In this case, a strategy typically referred to as the "stock replacement strategy" might make sense. For this example, we will:
- Buy 1 XBI Sep16 2022 60 strike price call at $16.30
With XBI at $74.06, the amount of time premium we are paying is $2.24, calculated as follows:
- Strike price + option price - stock price, or 60 +16.30 - 74.06 = $2.24
The remaining $14.06 of the option price comprises "intrinsic value," which will move point-for-point with the stock price. The bottom line: Changes in IV can impact the price of this option but will not do so nearly to the extent of the at-the-money call discussed above.
The particulars and the risk curves (which show the expected P/L as of a given date at a given price for XBI) appear below.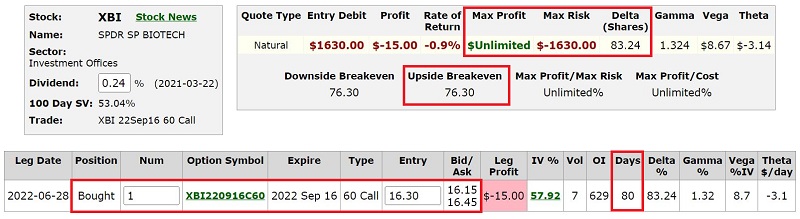
Key things to note:
- The cost to enter this trade is $1,630
- The maximum risk is $1,630, which would only be realized if the trade is held until September options expiration AND XBI is below $60 at that time
- The "breakeven price" is equal to the strike price plus the option price (60 + 16.30 = $76.30)
- The position has a "delta" of 83.24, which means it will behave similarly to holding 83 shares of XBI
- The maximum gain is theoretically unlimited; however, if a profit were taken at, say, $93 a share, the profit would be approximately $1,670 (93 stock price - 60 strike price - 16.30 option cost = 16.70, or roughly +102% ROI)
- If the option were sold if XBI hit $61, the loss would be (approximately) between -$935 and -$1,494
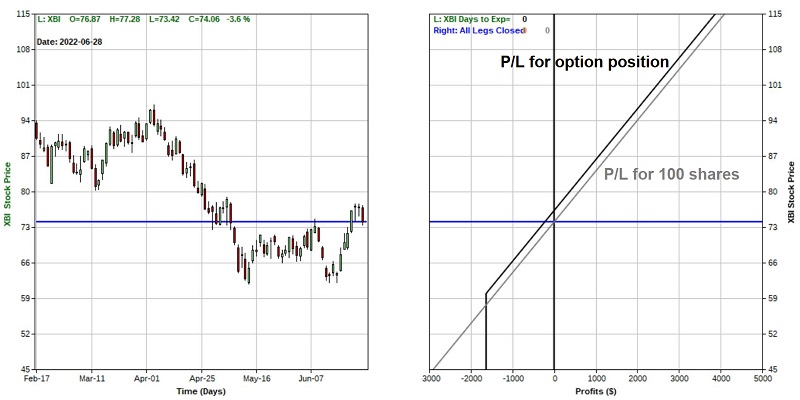
The bottom line: The option buyer holds a position roughly equivalent to holding 83 shares of XBI for a cost of $1,630 versus paying $7,406 to buy 100 shares of XBI. Whether or not this alternative appeals is up to each trader. Before deciding, consider the chart below, which displays the expected P/L for both the long 60 call position (black line) and the long 100 shares of XBI position (grey line).
What the research shows…
The stock replacement strategy can offer a trader the potential to participate in significant gains for a stock or ETF at a fraction of the cost of buying the actual shares and with limited risk.
The other key point to take away is the significant and potentially profound impact that changes in implied volatility can have on at-the-money and out-of-the-money options. The higher cost of buying deep-in-the-money options is less appealing than the siren song of low-priced and out-of-the-money options that many traders are drawn to. But the ability to participate point-for-point with the underlying shares (once the breakeven price of strike price + premium paid is exceeded) without being held hostage to the vagaries of implied volatility can be highly beneficial - especially when implied volatility is already at the high-end of the historical range.
As always, the trades highlighted above are for illustrative purposes only, not specific trading recommendations.