Big Picture Commodity Momentum

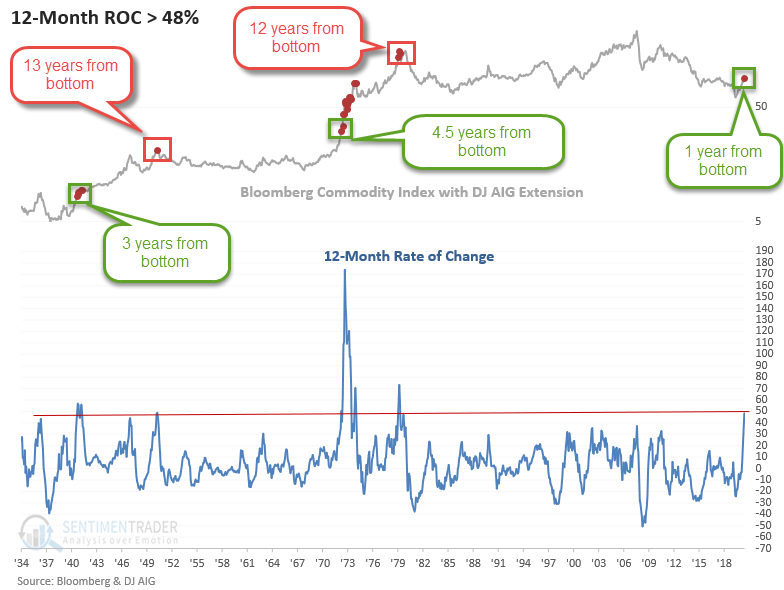
With April coming to a close, I thought I would share the following commodity chart now that it's been one year since the Bloomberg Commodity Index bottomed in April of 2020. The chart is similar to the one that I shared in a note on 4/23/21. However, it contains a data extension from the Dow Jones AIG Commodity Index. The historical extension provides us with some more insight into the potential outlook for commodities.
When I compare the current surge in commodities to other instances in history, the thrust looks more like the start of a trend versus the end of one.
COMMODITY CHART