Products
SentimenTrader Trading Tools
‍
Backtest Engine
My Trading Toolkit
Correlation Analysis
Seasonality
Market Prediction
Indicators & Data API
‍
Proprietary Indicators & Charts
Market Data API
Strategies & Scanner
‍
50+ Trading Strategies
Smart Stock Scanner
Smart Option Scanner
Research Reports
‍
Research Solutions
Reports Library
Free Resources
Simple Backtest Calculator
Simple Seasonality Calculator
The Kelly Criterion Calculator
Sentiment Geo Map
Public Research Reports
Education
Sentiment Indicators
Technical Indicators
Pricing
Company
About
In the News
Testimonials
Client Success Stories
Contact
Log inLoginSign up
< BACK TO ALL REPORTS

Big money managers come back

Jason Goepfert
2020-06-19
A survey of large money managers shows that they are overweight equities for the first time in months. History is limited, so there were only two other times when managers were underweight stocks for months on end, then turned positive. Both led to sustained recoveries as money continued to pour in.

On Wednesday, we saw that institutional investors were pulling money out of cash, the start of a potential reversal in a historic rush into money markets.

According to the latest Bank of America poll of large money managers, some of that cash is likely finding its way into stocks. For the first time in months, managers are net overweight equities.

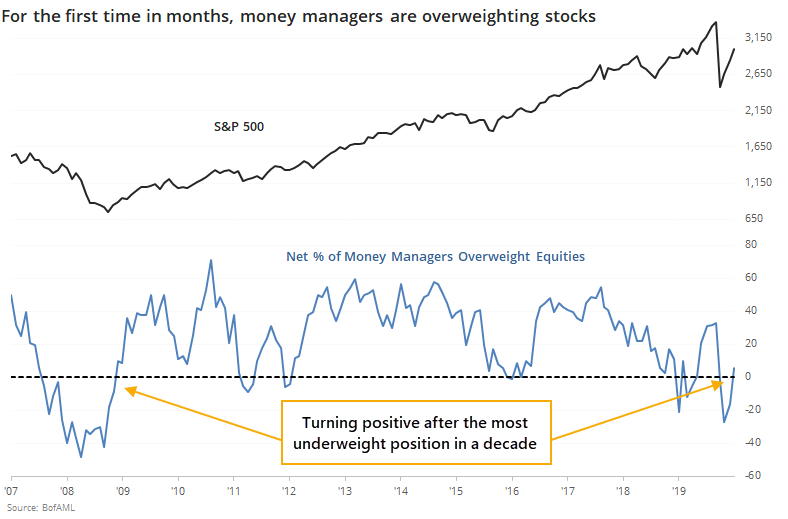
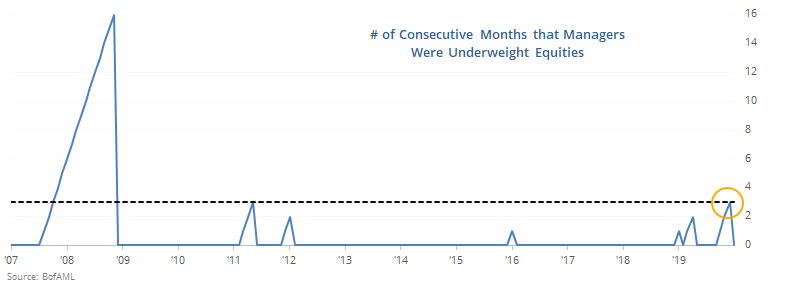
Surprisingly, the streak of three months of being underweight is tied for the 2nd-longest in 13 years.

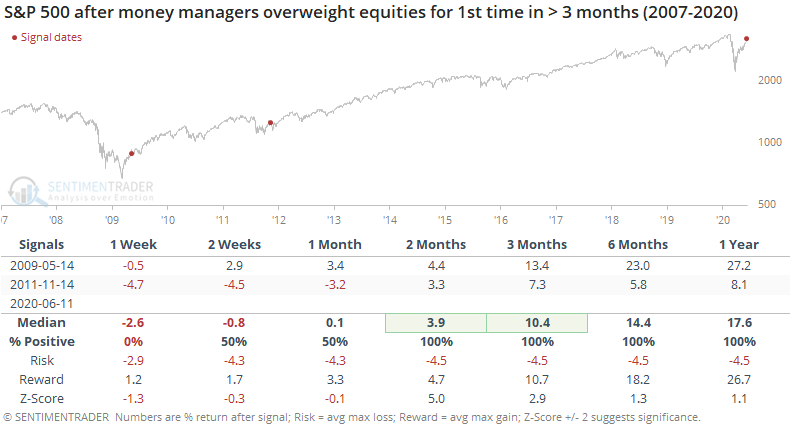
The sample size is ridiculously small, but the other two times when managers went overweight for the first time in 3 or more months, they were the beginnings of longer-term recoveries.

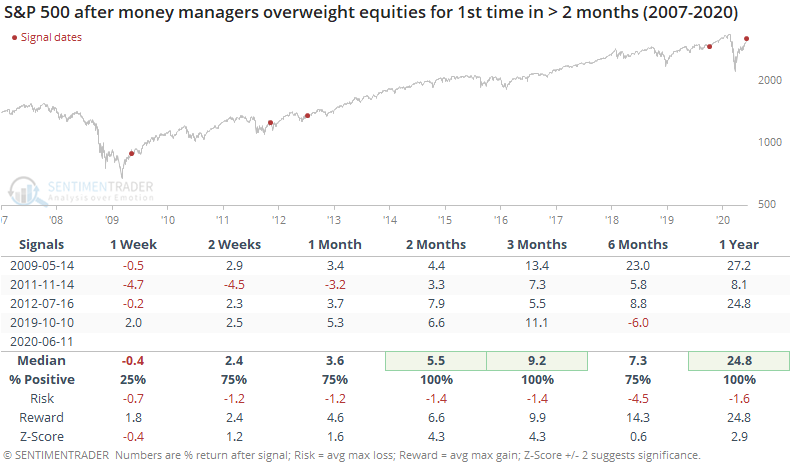
When managers returned to stocks after even two months of being underweight, it was also a good sign.

Granted, the study period is dominated by a historic bull market, or multiple bull markets depending on the definition, so results will tend to be skewed to the upside. Even so, the returns following these return-to-optimism signals were well above random. With a small sample size, the z-score requires that results not only be markedly different than random, but consistent, too, and these were, especially over the next 2-3 months.

We're not including it in the Active Studies due to limited history and the small sample, but it's one of those "environmental" indicators that suggest a tailwind.  There is quite a battle over that time frame, with signs of speculation and extreme optimism indicating a subdued summer, versus breadth thrusts and recoveries having an almost unblemished record at preceding higher prices, but more consistently over a 6-12 month time frame. This renewed optimism among money managers likely isn't enough to overcome the overhang of speculative activity and potential for a change in the White House.

PRODUCTS
SentimenTrader
Trading Tools
Indicators & Data API
‍
Strategies & Scanner
‍
Research Reports
FREE
RESOUrCES
Simple Backtest
Calculator
Simple Seasonality
Calculator
The Kelly Criterion
Calculator
Sentiment Geo Map
‍
Public Research Reports
‍
Education
Sentiment Indicators
‍
Technical Indicators
‍
Pricing
Bundle pricing
‍
FAQ
‍
Announcements
‍
COMPANY
‍
About
‍
In the News
‍
Testimonials
‍
Client Success Stories
CONTACT
‍
General Inquiries
‍
Media Inquiries
‍
Financial Professionals Inquiries
‍
© 2026 Sundial Capital Research Inc. All rights reserved.
Setsail Marketing
TermsPrivacyAffiliate Program
Risk Disclosure: The information and tools provided are for research and analytical purposes only and are not intended as investment advice. Market analysis involves uncertainty, and outcomes may differ from expectations. Users should conduct their own due diligence and consider their individual circumstances before making any financial decisions. Past performance is not necessarily indicative of future results.

Hypothetical Performance Disclosure: Hypothetical performance results have many inherent limitations, some of which are described below. No representation is being made that any account will or is likely to achieve profits or losses similar to those shown; in fact, there are frequently sharp differences between hypothetical performance results and the actual results subsequently achieved by any particular trading program. One of the limitations of hypothetical performance results is that they are generally prepared with the benefit of hindsight. In addition, hypothetical trading does not involve financial risk, and no hypothetical trading record can completely account for the impact of financial risk of actual trading. for example, the ability to withstand losses or to adhere to a particular trading program in spite of trading losses are material points which can also adversely affect actual trading results. There are numerous other factors related to the markets in general or to the implementation of any specific trading program which cannot be fully accounted for in the preparation of hypothetical performance results and all which can adversely affect trading results.

Testimonial Disclosure: Testimonials appearing on this website may not be representative of other clients or customers and is not a guarantee of future performance or success.