Products
SentimenTrader Trading Tools
‍
Backtest Engine
My Trading Toolkit
Correlation Analysis
Seasonality
Market Prediction
Indicators & Data API
‍
Proprietary Indicators & Charts
Market Data API
Strategies & Scanner
‍
50+ Trading Strategies
Smart Stock Scanner
Smart Option Scanner
Research Reports
‍
Research Solutions
Reports Library
Free Resources
Simple Backtest Calculator
Simple Seasonality Calculator
The Kelly Criterion Calculator
Sentiment Geo Map
Public Research Reports
Education
Sentiment Indicators
Technical Indicators
Pricing
Company
About
In the News
Testimonials
Client Success Stories
Contact
Log inLoginSign up
< BACK TO ALL REPORTS

Big Money gets even more bearish

Jason Goepfert
2022-10-18
The latest survey of big money managers from Barron's shows that many of them moved out of the neutral camp. Most of those became bearish, with the 2nd-highest percentage of bears in the survey's history.

Key points:

  • The latest survey of large money managers by Barron's showed another drop in sentiment
  • The percentage of bears jumped to the 2nd-highest level in the history of the survey
  • While considered "smart money," the poll tends to have a modest contrary history

Big Money becomes even more bearish

Many contrary indicators are showing some of the most depressed sentiment in 20 years or more. There are always two sides to the coin; while others are selling, some intrepid (or foolhardy) souls are doing the opposite.

At extremes, the two groups tend to be diametrically opposed to each other, and there are compelling signs that we've been seeing that, with Smart Money Confidence pinned above 70% for a month.

Not all "smart money" indicators are showing optimism, though, and not all indicators that we think should be considered smart money genuinely are. One of those is the semi-annual Barron's survey of the Big Money. These are large money managers with hundreds of billions under management. But like we've seen repeatedly over the years, they can collectively suffer group-think just like the rest of us.

The latest survey, which concluded in early October, showed another dip in the percentage of bullish managers minus those who are bearish. It overtook the prior survey to claim infamy as the 2nd-lowest reading in the survey's history.

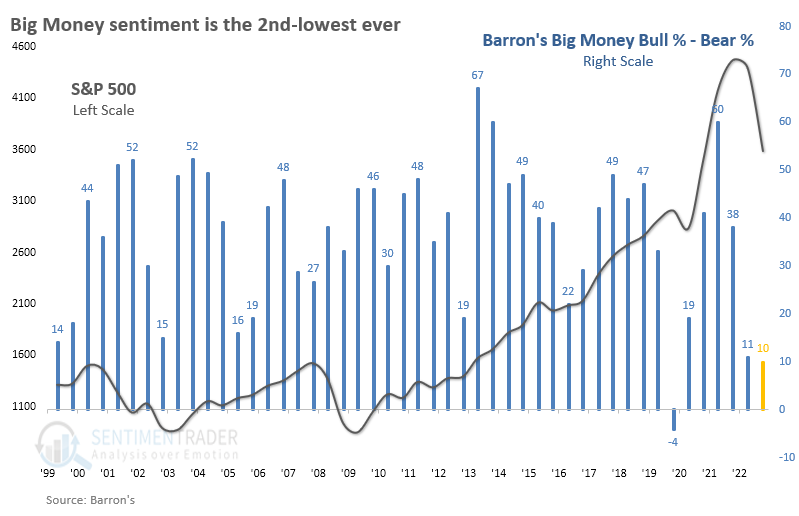
The primary culprit was a surge in bearish managers. The summer decline moved a lot of folks out of the neutral camp, and most of those decided the negative trend was here to stay. The only survey with (slightly) more bears was from the fall of 2019, when 31% of managers expected stocks to fall.

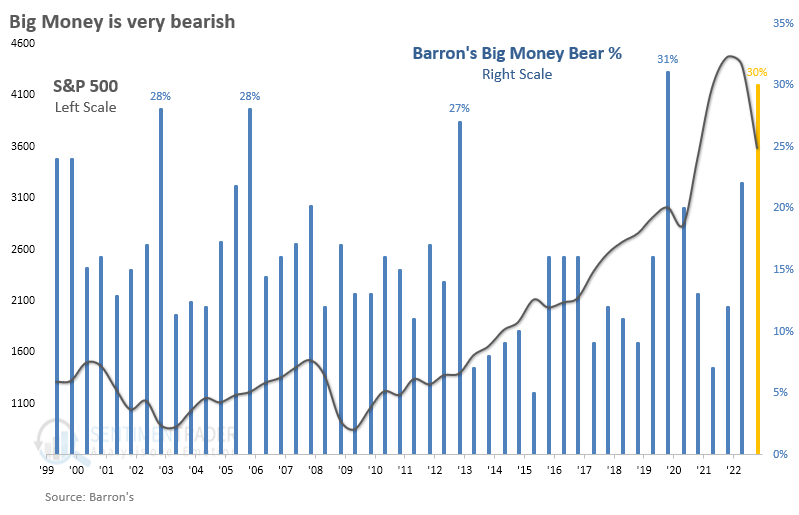
There are few precedents of so many bears, given the tendency for money managers to be optimistic, the twice-yearly nature of the survey, and the inherently limiting function of looking at extremes.

What the research tells us...

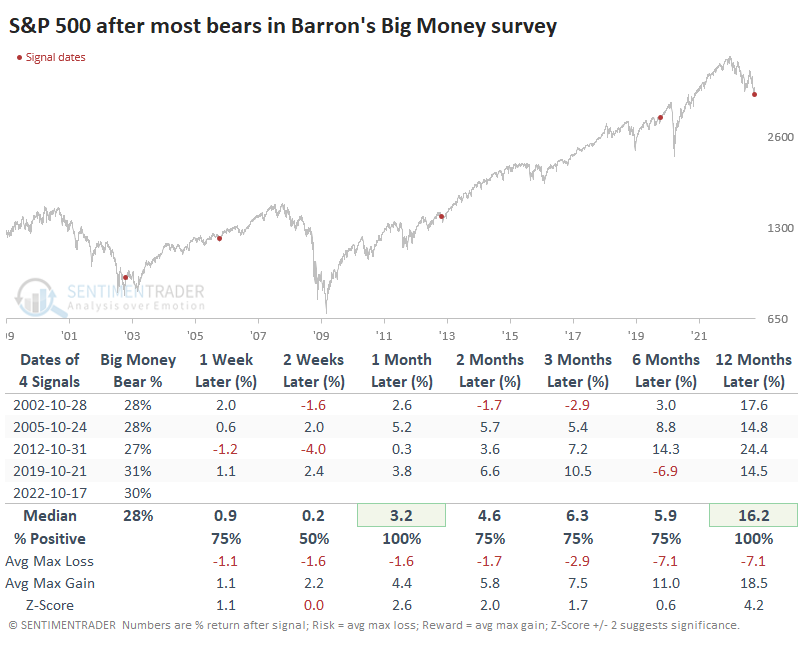
If we're cautious because of the continual failure of buyers to show any follow-through, then it's comforting to see that some of the largest and brightest investors in the world agree with us. But they're not perfect, and when they swing to extremes, stocks still tend to do the opposite, or at least not fully realize big money managers' hopes and fears.

PRODUCTS
SentimenTrader
Trading Tools
Indicators & Data API
‍
Strategies & Scanner
‍
Research Reports
FREE
RESOUrCES
Simple Backtest
Calculator
Simple Seasonality
Calculator
The Kelly Criterion
Calculator
Sentiment Geo Map
‍
Public Research Reports
‍
Education
Sentiment Indicators
‍
Technical Indicators
‍
Pricing
Bundle pricing
‍
FAQ
‍
Announcements
‍
COMPANY
‍
About
‍
In the News
‍
Testimonials
‍
Client Success Stories
CONTACT
‍
General Inquiries
‍
Media Inquiries
‍
Financial Professionals Inquiries
‍
© 2026 Sundial Capital Research Inc. All rights reserved.
Setsail Marketing
TermsPrivacyAffiliate Program
Risk Disclosure: The information and tools provided are for research and analytical purposes only and are not intended as investment advice. Market analysis involves uncertainty, and outcomes may differ from expectations. Users should conduct their own due diligence and consider their individual circumstances before making any financial decisions. Past performance is not necessarily indicative of future results.

Hypothetical Performance Disclosure: Hypothetical performance results have many inherent limitations, some of which are described below. No representation is being made that any account will or is likely to achieve profits or losses similar to those shown; in fact, there are frequently sharp differences between hypothetical performance results and the actual results subsequently achieved by any particular trading program. One of the limitations of hypothetical performance results is that they are generally prepared with the benefit of hindsight. In addition, hypothetical trading does not involve financial risk, and no hypothetical trading record can completely account for the impact of financial risk of actual trading. for example, the ability to withstand losses or to adhere to a particular trading program in spite of trading losses are material points which can also adversely affect actual trading results. There are numerous other factors related to the markets in general or to the implementation of any specific trading program which cannot be fully accounted for in the preparation of hypothetical performance results and all which can adversely affect trading results.

Testimonial Disclosure: Testimonials appearing on this website may not be representative of other clients or customers and is not a guarantee of future performance or success.