
Beware the "falling safe" in the grain markets

Key points
- Corn and Soybeans have been in steady decline for over two years
- As grain markets tend to be choppy, there may be a temptation for some traders to try to "pick the bottom"
- Seasonality strongly suggests that traders fight that urge and continue to focus on the short side - or at least stand aside
Corn and Soybean prices have plunged
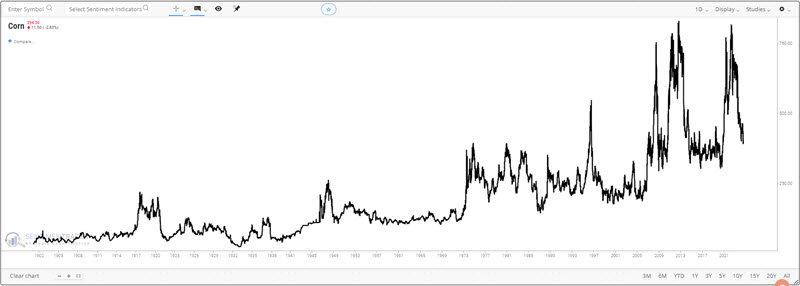
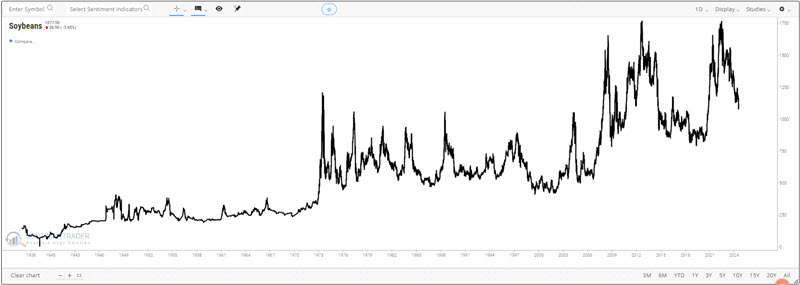
Due to the rigidity of the planting and harvesting seasons in the U.S., corn and soybeans have long been highly cyclical markets. The long-term charts for each below reflect this.
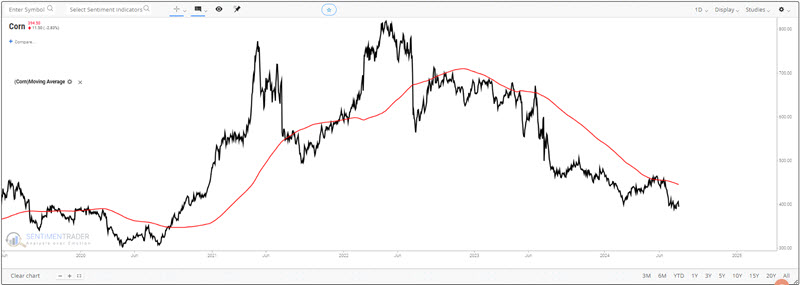
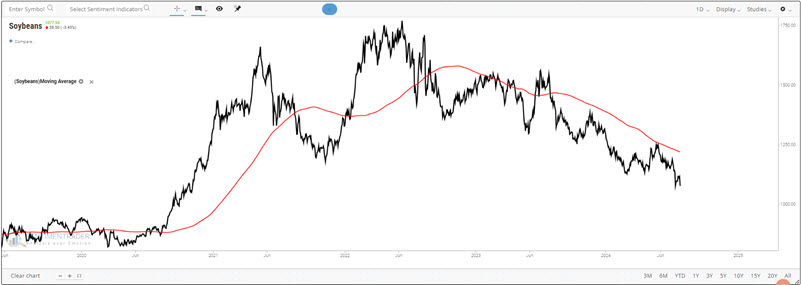
More recently, both markets have declined in price for almost two years, as seen in the zoomed-in charts below.
When highly cyclical markets trend in one direction for a long time, it typically sets the stage for a meaningful reversal. As a result, some traders may wonder if now is the time to start looking for a buying opportunity in grains. While anything is always possible in the markets, an objective look at grain market history suggests that the answer is "No, not yet."
Seasonality is still a heavy weight on these markets
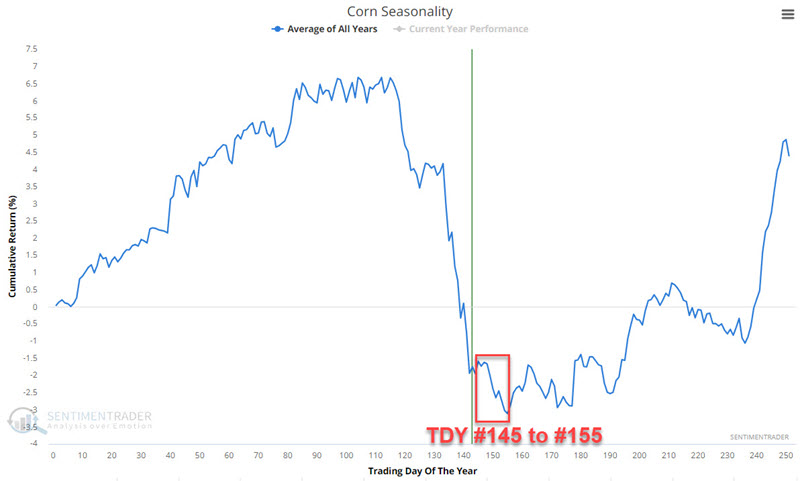
We covered corn and soybean seasonality recently (here and here). But at this moment, it is worth another look. Let's start with corn. The chart below displays the annual seasonal trend for corn futures and highlights the period from Trading Day of the Year (TDY) #145 through the close of TDY #155. For 2024, this period extends from the close on 2024-07-30 through 2024-08-13.
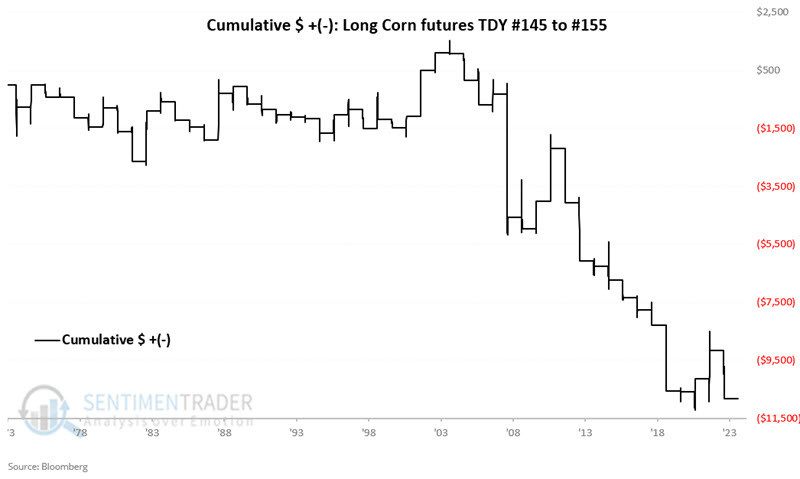
The chart below displays the hypothetical dollar +(-) from holding long one corn futures contract only during this period every year since 1974.
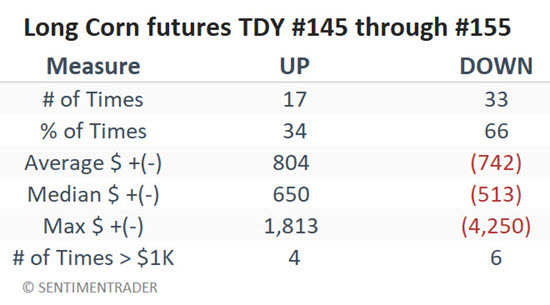
The table below summarizes corn performance during this period.
These results do not guarantee further weakness for corn in the weeks ahead. However, they strongly suggest that traders either focus on playing the short side or stand aside until some concrete signs of a market bottom and/or reversal appear.
The risk may be even more significant with soybeans
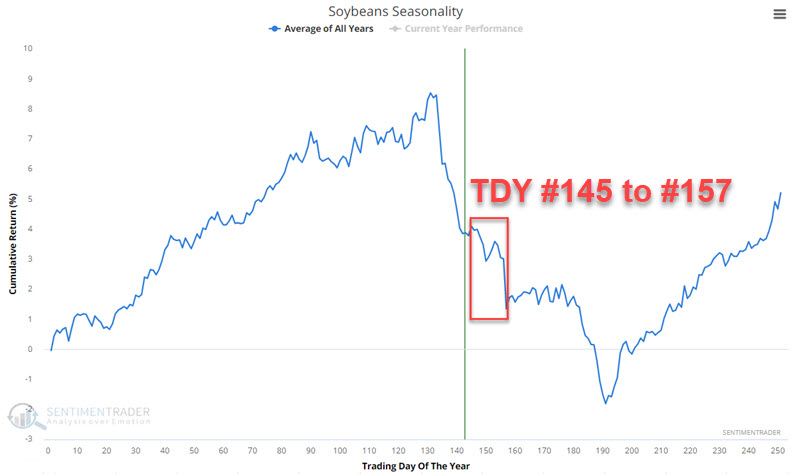
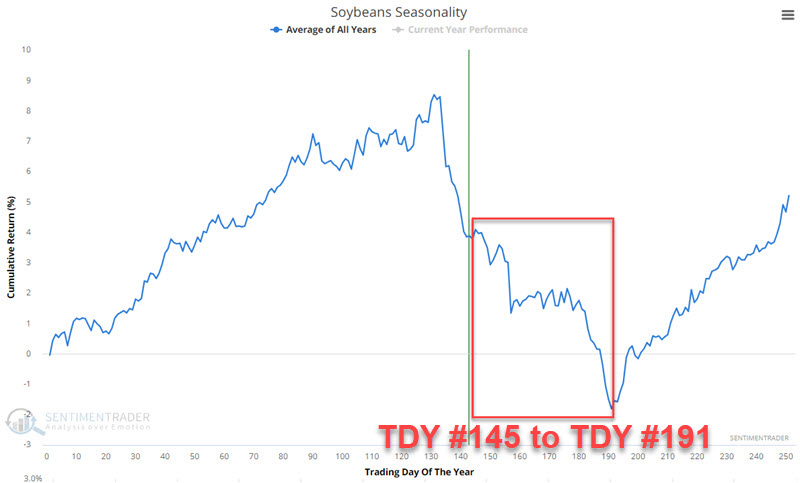
Let's start with the short-term. The chart below displays the annual seasonal trend for soybean futures and highlights the period from Trading Day of the Year (TDY) #145 through the close of TDY #157. For 2024, this period extends from the close on 2024-07-30 through 2024-08-15.
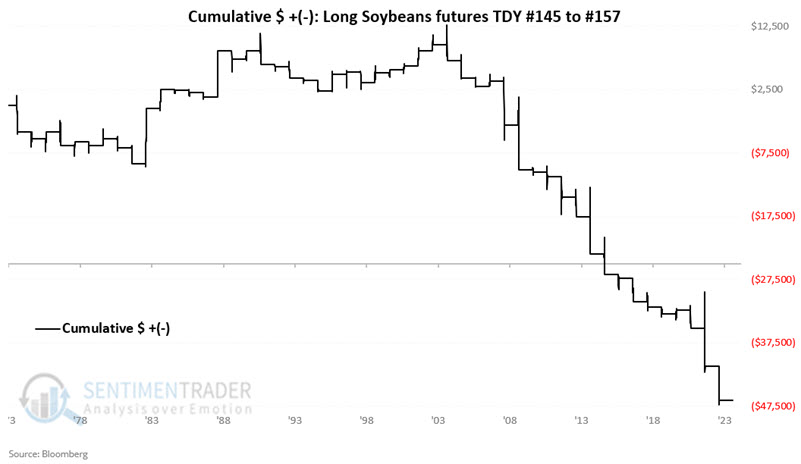
The chart below displays the hypothetical dollar +(-) from holding long one soybeans futures contract only during this period every year since 1974.
The table below summarizes corn performance during this period.
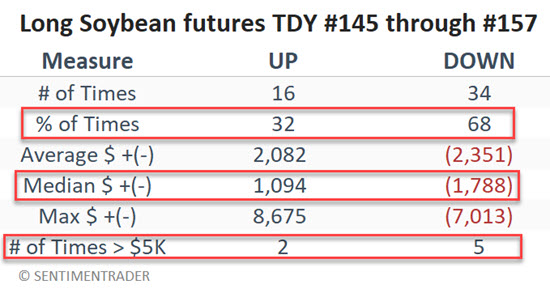
Note the low Win Rate (32%), the median loss of 1.63 times the median gain (-$1,788 versus +$1,094), and moves more than $5,000, skewing 5 to 2 to the losing side). A guarantee of soybean weakness in the weeks ahead? Nope. A good reason to avoid trying to "catch a falling safe" by picking a bottom in beans? We would argue, "Yes."
The outlook for beans gets even worse if we extend it to the end of the unfavorable seasonal period highlighted in the chart below.
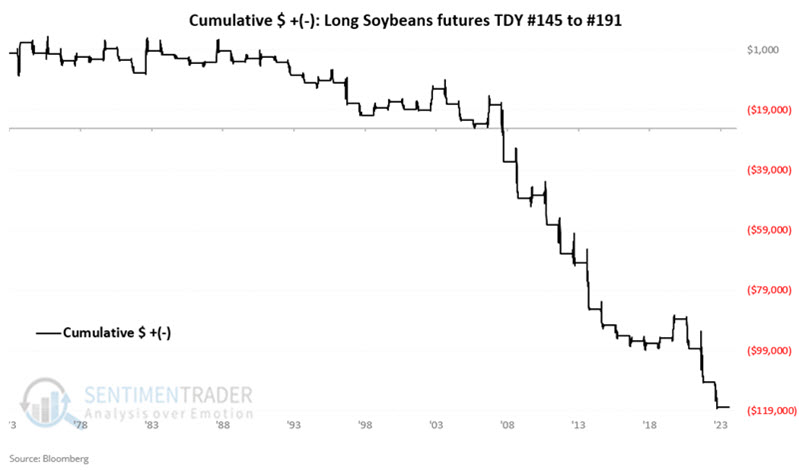
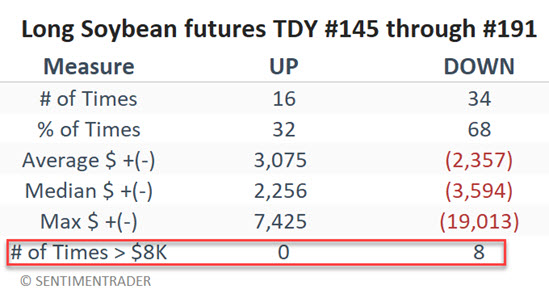
The chart below displays the hypothetical dollar +(-) from holding long one soybeans futures contract only during the TDY #145 to TDY #191 period every year since 1974. For 2024, this period extends out to 2024-10-03.
The table below summarizes corn performance during this period.
What the research tells us…
Since June 14th, corn futures have lost almost $2,800 in contract value; since July 10th, soybean futures have lost almost $3,200 in contract value. Are these declines getting overdone? That is certainly possible, and any time a market gets oversold, it can bounce higher quickly. Nevertheless, the history of these two markets strongly suggests that now is not the time to play the long side. Is it too late to jump in on the short side? That is an entirely different question. Selling short into extreme weakness can be highly profitable if the current trend continues, but it must be accompanied by a specific and unwavering stop-loss plan in case things reverse quickly. Many years of market analysis suggest that the best time to use seasonal trends is to look for situations when price action is trending in the direction of the expected seasonal trend. That is certainly the case for corn and beans now.