
Beware silver in spring

Key Points
- Silver has shown a historical tendency for inferior performance during May and June
- Results can vary widely from year-to-year
A seasonally unfavorable period for silver
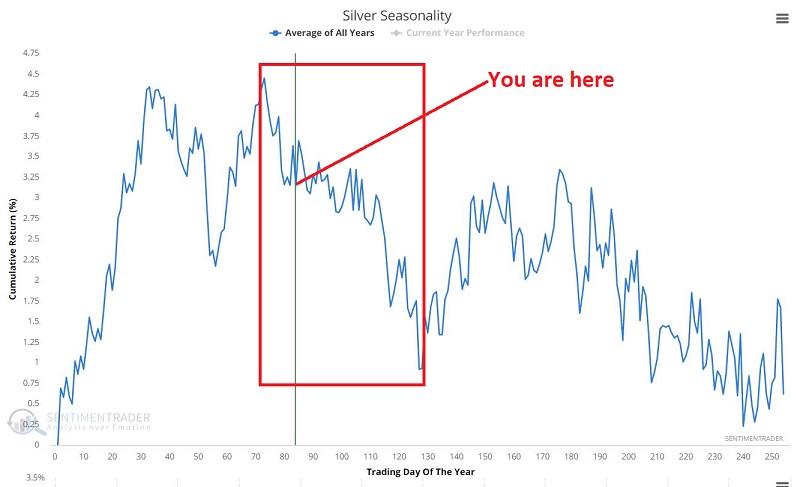
The chart below displays the annual seasonal trend for silver futures. Note that corn is presently in a favorable period that extends from the trading day of the year #73 through the trading day of the year #127. We are still in the early portion of that period.
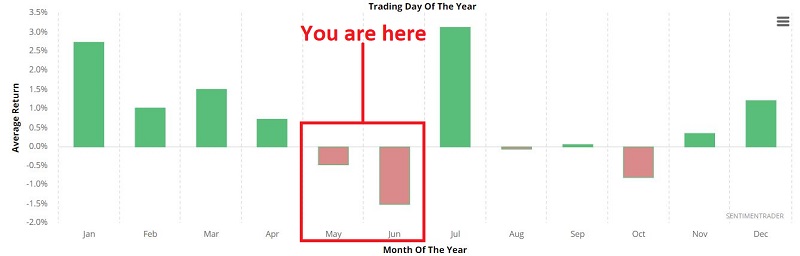
The chart below highlights historical tendencies for silver on a month-by-month basis.
THE KEY THING TO NOTE: One of the keys to trading success is putting the odds on your side as frequently as possible. The information in the charts above is not intended to imply that silver is "doomed" to fall in the months directly ahead. The real purpose is to highlight that a trader taking a long position in silver should have an excellent reason for doing so, as they are clearly "swimming upstream."
In this recent article, the annual seasonal trend for silver. Since that date, silver futures have sold off hard, as you can see in the chart below.
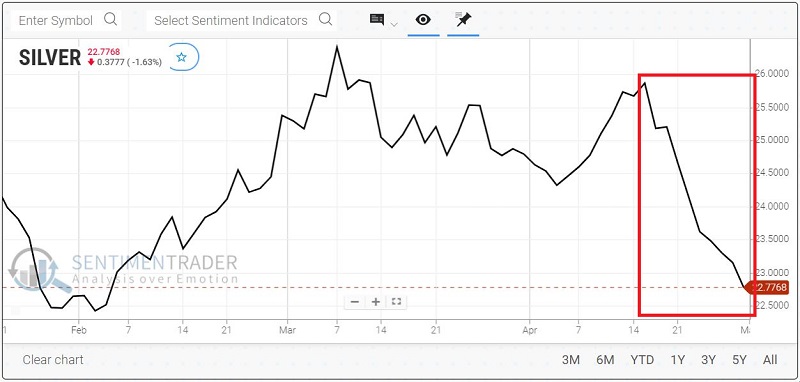
Will this downtrend continue? We can't predict. But to assess the odds, let's take a closer look at historical results.
May and June in Silver
The chart below displays the hypothetical $ +(-) achieved by holding a long position in silver futures only during May and June every year since 1970.
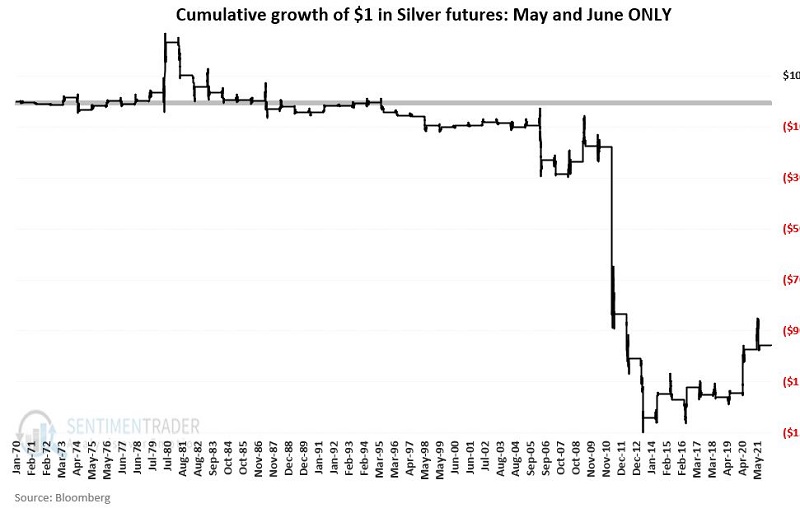
The table below displays a summary of the results.

The key things to note:
- A 42% Win Rate reminds us that weakness is no "sure thing"
- Note that silver has been "up" during May/June each of the last three years (in theory, this suggests a higher probability of a reversion to the mean, i.e., a down May/June period this year)
- When things go badly, they occasionally go "very badly" (five separate years with a loss exceeding -$10,000
Cutting things a little finer
Let's "zoom in" just a bit and highlight the performance for silver futures only from:
The close on the 2nd trading day of May
Through the close on the 19th trading day of June
For 2022, this period extends from the close on 5/3/2022 through the close on ???
The chart below displays the hypothetical $ +(-) achieved by holding a long position in silver futures only during the period described above each year since 1970.
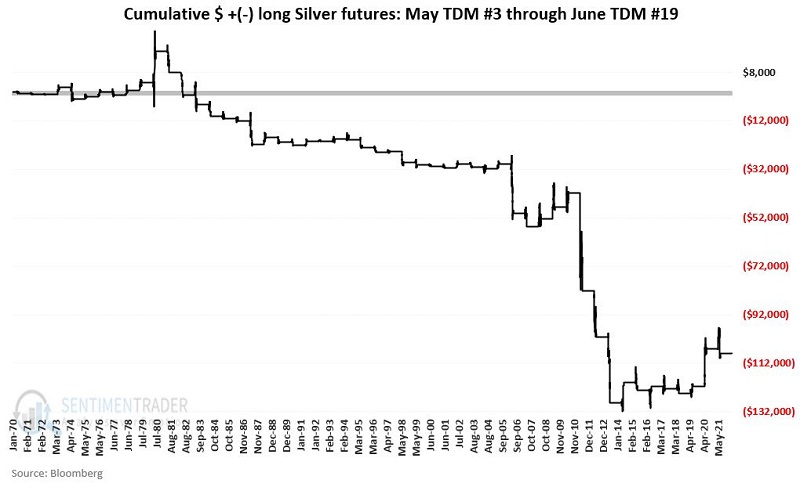
The table below displays a summary of the results.
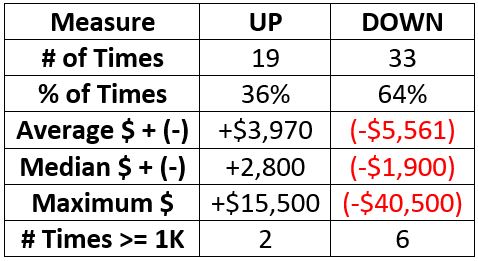
The Win Rate drops to 36%, and the cumulative loss increases from -$95,630 to -$108,095.
Note that traders who are not comfortable trading futures contracts can consider ticker SLV (iShares Silver Trust), an ETF designed to track the price of silver futures.
What the research tells us…
Silver is presently extremely oversold. Nine consecutive down days and a 3-day RSI below 3 suggest that a technical bounce is possible. However, before piling into the long side of silver, traders are advised to weigh the fact that May/June is historically the weakest time of year for silver.