Products
SentimenTrader Trading Tools
‍
Backtest Engine
My Trading Toolkit
Correlation Analysis
Seasonality
Market Prediction
Indicators & Data API
‍
Proprietary Indicators & Charts
Market Data API
Strategies & Scanner
‍
50+ Trading Strategies
Smart Stock Scanner
Smart Option Scanner
Research Reports
‍
Research Solutions
Reports Library
Free Resources
Simple Backtest Calculator
Simple Seasonality Calculator
The Kelly Criterion Calculator
Sentiment Geo Map
Public Research Reports
Education
Sentiment Indicators
Technical Indicators
Pricing
Company
About
In the News
Testimonials
Client Success Stories
Contact
Log inLoginSign up
< BACK TO ALL REPORTS

Beware gold stocks in October

Jay Kaeppel
2023-10-02
During the past 65 years, gold stock performance during October has been, well, downright spooky. This piece reviews the history and raises several questions for gold stock investors.

Key points

  • Gold stock miners tend to show weakness during October
  • History suggests that investors carefully consider how much exposure they want to gold miners during the weakest period of the year

Gold Bugs Index seasonality stands as a warning

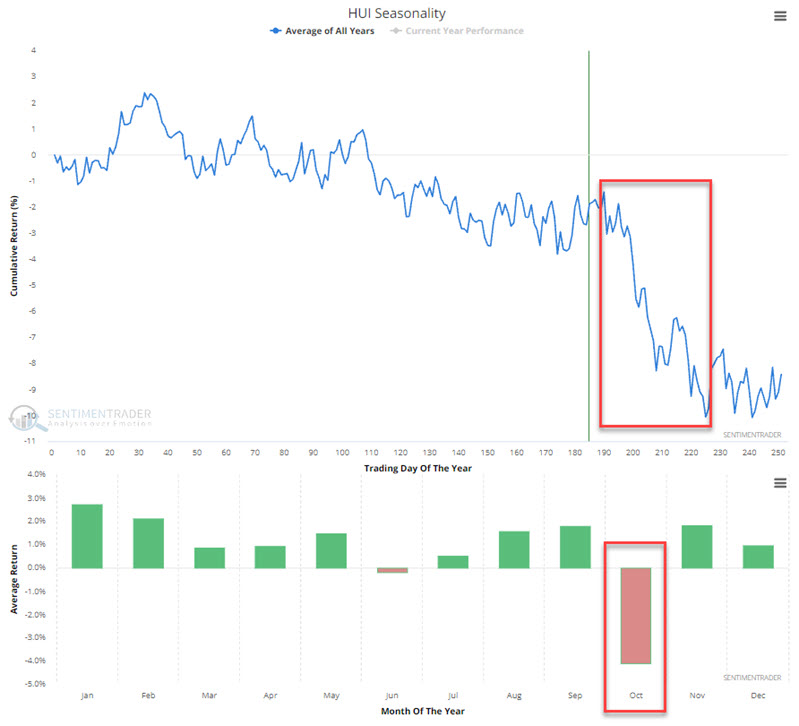
Ticker HUI represents the Gold Bugs Index, which tracks an index of gold mining stocks and has a history dating back to 1957.

The chart below displays the Annual Seasonal Trend for ticker HUI. The period of significant concern is apparent and encompasses the entire month of October.
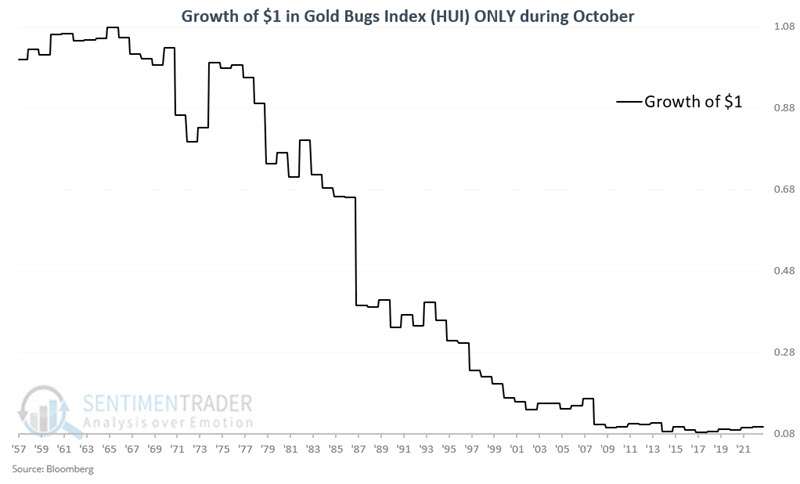
To better understand the potential danger associated with holding gold stocks in November, the chart below displays the cumulative growth (or, more accurately, decline) of $1 invested in gold stocks only during October every year from 1958 through 2022. The cumulative result has been a loss of -90.3%.
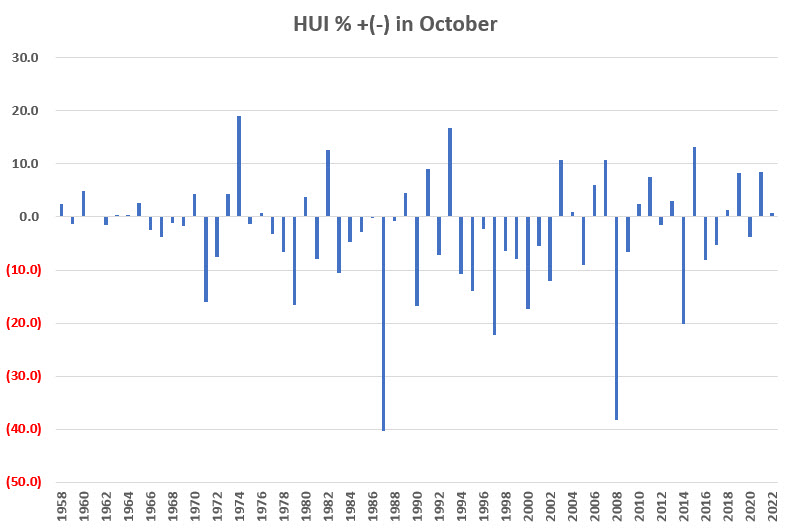
Does this mean that gold stocks never rise during October, and investors should avoid them like the plague? That's not exactly the lesson. The chart below displays the percentage +/- for ticker HUI during October each year. Note that HUI gained more than 10% on six occasions during this supposedly awful month. Also, results have somewhat flattened out in the last decade, and October has shown a gain in four of the previous five years.
The table below summarizes the October performance for HUI.
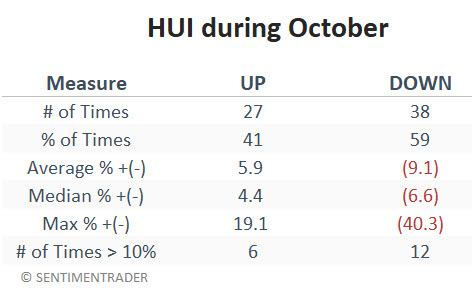
The bottom line is that results have skewed decidedly to the negative side.

What the research tells us…

The good news is that during the last 5-10 years, gold stock performance during October has improved from disastrous to merely so-so. Based on the information above, there are two key points to keep remember. First, if you plan to hold gold stocks during October, you must understand that you may be swimming upstream against a well-established historical tide. Conversely, it is a mistake to assume that gold stocks are doomed to decline solely on the calendar month (a 41% Win Rate is different than a 0% Win Rate). 

The bottom line: the relevant question remains "Is this a good place to allocate capital right now?"

PRODUCTS
SentimenTrader
Trading Tools
Indicators & Data API
‍
Strategies & Scanner
‍
Research Reports
FREE
RESOUrCES
Simple Backtest
Calculator
Simple Seasonality
Calculator
The Kelly Criterion
Calculator
Sentiment Geo Map
‍
Public Research Reports
‍
Education
Sentiment Indicators
‍
Technical Indicators
‍
Pricing
Bundle pricing
‍
FAQ
‍
Announcements
‍
COMPANY
‍
About
‍
In the News
‍
Testimonials
‍
Client Success Stories
CONTACT
‍
General Inquiries
‍
Media Inquiries
‍
Financial Professionals Inquiries
‍
© 2026 Sundial Capital Research Inc. All rights reserved.
Setsail Marketing
TermsPrivacyAffiliate Program
Risk Disclosure: The information and tools provided are for research and analytical purposes only and are not intended as investment advice. Market analysis involves uncertainty, and outcomes may differ from expectations. Users should conduct their own due diligence and consider their individual circumstances before making any financial decisions. Past performance is not necessarily indicative of future results.

Hypothetical Performance Disclosure: Hypothetical performance results have many inherent limitations, some of which are described below. No representation is being made that any account will or is likely to achieve profits or losses similar to those shown; in fact, there are frequently sharp differences between hypothetical performance results and the actual results subsequently achieved by any particular trading program. One of the limitations of hypothetical performance results is that they are generally prepared with the benefit of hindsight. In addition, hypothetical trading does not involve financial risk, and no hypothetical trading record can completely account for the impact of financial risk of actual trading. for example, the ability to withstand losses or to adhere to a particular trading program in spite of trading losses are material points which can also adversely affect actual trading results. There are numerous other factors related to the markets in general or to the implementation of any specific trading program which cannot be fully accounted for in the preparation of hypothetical performance results and all which can adversely affect trading results.

Testimonial Disclosure: Testimonials appearing on this website may not be representative of other clients or customers and is not a guarantee of future performance or success.