Products
SentimenTrader Trading Tools
‍
Backtest Engine
My Trading Toolkit
Correlation Analysis
Seasonality
Market Prediction
Indicators & Data API
‍
Proprietary Indicators & Charts
Market Data API
Strategies & Scanner
‍
50+ Trading Strategies
Smart Stock Scanner
Smart Option Scanner
Research Reports
‍
Research Solutions
Reports Library
Free Resources
Simple Backtest Calculator
Simple Seasonality Calculator
The Kelly Criterion Calculator
Sentiment Geo Map
Public Research Reports
Education
Sentiment Indicators
Technical Indicators
Pricing
Company
About
In the News
Testimonials
Client Success Stories
Contact
Log inLoginSign up
< BACK TO ALL REPORTS

Beware Biotech

Jay Kaeppel
2023-08-03
The biotech sector has acted more like a healthcare sector than a technology sector so far in 2023. A combination of seasonality and stock market risk levels continues to warn investors, particularly in the short term.

Key points

  • Biotech has entered a short, unfavorable time of year
  • Likewise, this sector has tended to perform poorly when Stock Risk Levels are high
  • While the current confluence of indicators guarantees nothing, they do suggest that caution may be in order in the short run for this volatile sector

IBB has entered a short but generally unfavorable time of year

The chart below displays the annual seasonal trend for iShares Biotechnology ETF (IBB)

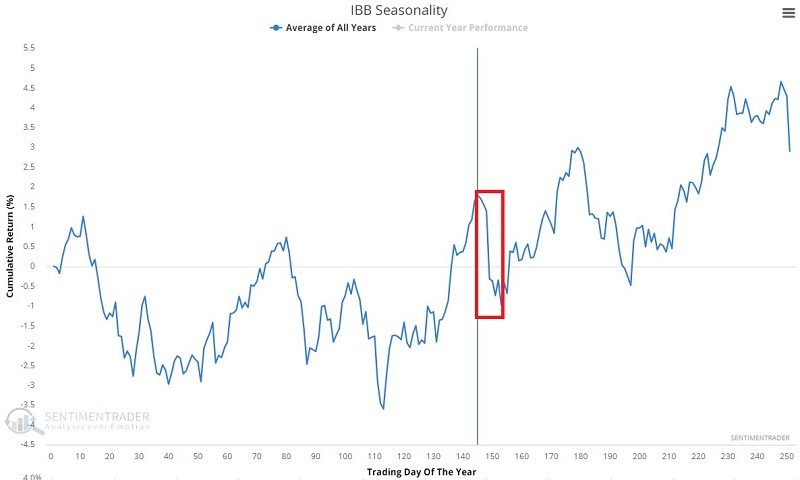
The red box highlights the period that extends from the close on Trading Day of Year #145 through TDY #159. For 2023 this period extends from the close on 2023-08-1 through the close on 2023-08-21.

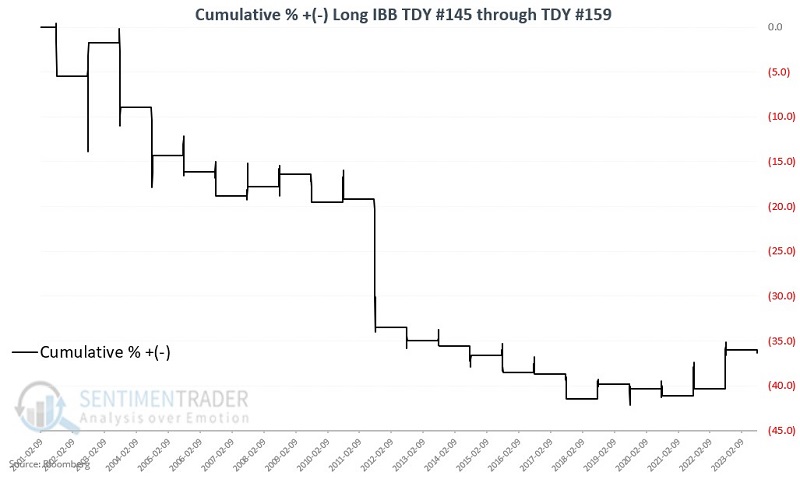
The chart below displays the hypothetical cumulative $ +(-) from holding a long position in IBB only during this unfavorable period every year since 2001.

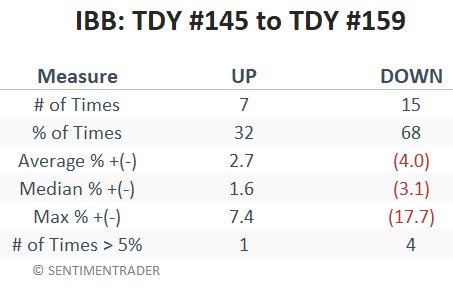
The table below summarizes IBB's performance during this unfavorable period.

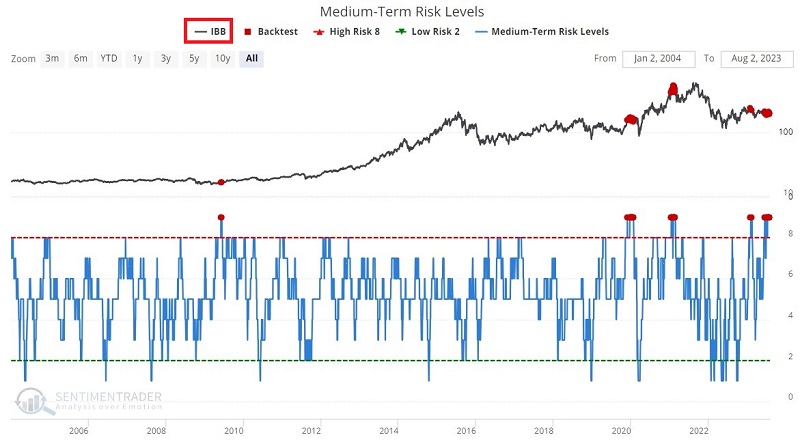
Medium-Term Risk Levels also cast a short-term pall

Our Medium-Term Risk Levels indicator is heavily based on the spread between the Smart and Dumb Money Confidence indexes. The chart below highlights when the Medium-Term Risk Levels indicator was equal to nine versus IBB.

The table below summarizes IBB performance following all readings of 9. 

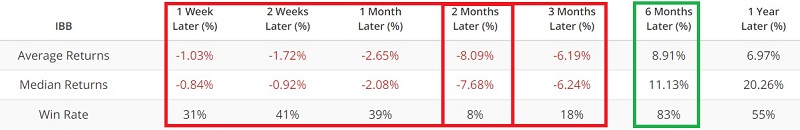
The sample size is relatively small, so this should not be as some trading "signal." Still, Average and Median Returns are negative for each time frame out to three months. Two months have shown only an 8% Win Rate. Combined with the unfavorable seasonality above, this suggests short-term caution in biotech.

What the research tells us…

No indicator or combination of indicators guarantees anything, particularly when dealing with short-term time frames and relatively small sample sizes. Nevertheless, the confluence of indicators highlighted above suggests that a trader should have an excellent reason for wanting to jump into the long side of the biotech sector in the near term. On the other hand, if the sector declines in the weeks ahead, it may set the stage for a decent rebound.

PRODUCTS
SentimenTrader
Trading Tools
Indicators & Data API
‍
Strategies & Scanner
‍
Research Reports
FREE
RESOUrCES
Simple Backtest
Calculator
Simple Seasonality
Calculator
The Kelly Criterion
Calculator
Sentiment Geo Map
‍
Public Research Reports
‍
Education
Sentiment Indicators
‍
Technical Indicators
‍
Pricing
Bundle pricing
‍
FAQ
‍
Announcements
‍
COMPANY
‍
About
‍
In the News
‍
Testimonials
‍
Client Success Stories
CONTACT
‍
General Inquiries
‍
Media Inquiries
‍
Financial Professionals Inquiries
‍
© 2026 Sundial Capital Research Inc. All rights reserved.
Setsail Marketing
TermsPrivacyAffiliate Program
Risk Disclosure: The information and tools provided are for research and analytical purposes only and are not intended as investment advice. Market analysis involves uncertainty, and outcomes may differ from expectations. Users should conduct their own due diligence and consider their individual circumstances before making any financial decisions. Past performance is not necessarily indicative of future results.

Hypothetical Performance Disclosure: Hypothetical performance results have many inherent limitations, some of which are described below. No representation is being made that any account will or is likely to achieve profits or losses similar to those shown; in fact, there are frequently sharp differences between hypothetical performance results and the actual results subsequently achieved by any particular trading program. One of the limitations of hypothetical performance results is that they are generally prepared with the benefit of hindsight. In addition, hypothetical trading does not involve financial risk, and no hypothetical trading record can completely account for the impact of financial risk of actual trading. for example, the ability to withstand losses or to adhere to a particular trading program in spite of trading losses are material points which can also adversely affect actual trading results. There are numerous other factors related to the markets in general or to the implementation of any specific trading program which cannot be fully accounted for in the preparation of hypothetical performance results and all which can adversely affect trading results.

Testimonial Disclosure: Testimonials appearing on this website may not be representative of other clients or customers and is not a guarantee of future performance or success.