
Betting on AAPL (or not) - cheaply

Key Points
- The stock market has been roaring higher. However, Apple stock has been noticeably lagging
- Some see this as an opportunity to buy; others see it as a serious warning sign
- We cannot say with any certainty who will be right or wrong - but we can highlight ways to play either outlook
AAPL is suddenly a laggard
Apple has been a market leader literally for decades - even more so in recent years as a member of the so-called "Magnificent 7" leading stocks. But AAPL stock performance - absolute and relative to the overall market - has leveled off and fallen notably recently. This has created the usual debate. Is this a buying opportunity for AAPL shares? Or is it a sign of worse things to come for this once highflyer?
Because we are not pundits or prognosticators (or even very good predictors), we will not even attempt to answer that question. But for those holding a specific opinion, we can offer ideas on how to express that opinion.
We can note this: To trade shares of AAPL requires a significant capital commitment, whether buying shares or attempting to sell them short. As of the close on 2024-03-01, AAPL shares traded at $179.66. Thus, the purchase of 100 shares requires a commitment of $17,966. Selling short would require a significant margin requirement and entail a high degree (theoretically unlimited). So, let's consider some less costly - and limited risk - alternatives.
First, a look at the implied volatility
The price of an in-the-money option (i.e., a call option with a strike price below the price of the underlying security or a put option with a strike price above the price of the underlying security) is comprised of intrinsic value (the difference between the strike price and the underlying security price) and time premium. The price of an out-of-the-money option is comprised solely of time premium. Time premium is essentially an amount the option buyer pays to an option seller to induce the option seller to sell the option in the first place.
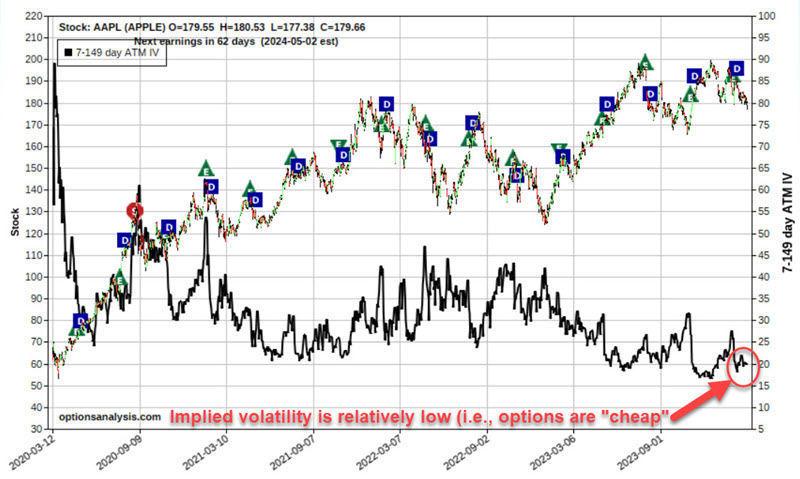
An options pricing model calculates implied volatility and indicates how much time premium is built into the price of a given option or options for a given security. If IV is relatively low historically, it suggests that the time premium is relatively low and that options are "cheap." This is generally a good time to consider buying options.
As we see in the chart below (all charts below are courtesy of www.Optionsanalysis.com), implied volatility for options on AAPL is at the low end of its historical range, i.e., AAPL options can be considered "cheap." As a result, we will focus below on buying premium.
A bullish play
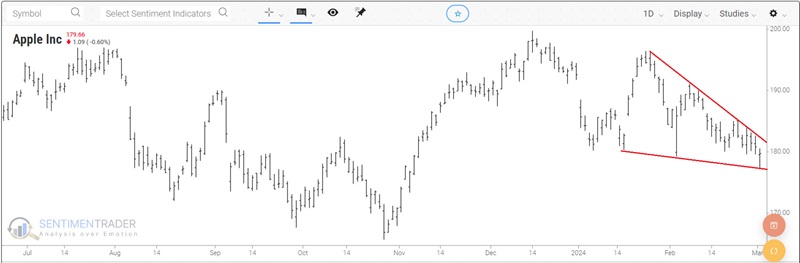
Some traders may look at the chart of AAPL prices below, see a declining wedge pattern, and conclude that AAPL shares will break out hard to the upside in the months ahead.
Let's consider a straightforward approach to playing this specific outlook. The example below essentially amounts to a "stock replacement" position. Our bullish example involves:
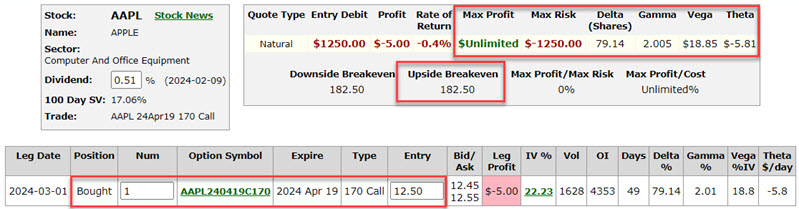
- Buying 1 AAPL April19 2024 170 call @ $12.50
The particulars for this position appear in the screenshot below.

The risk curves (i.e., the expected $P/L for this position as of a given price for AAPL shares on different dates leading up to options expiration on April 19) appear below.
Things to note:
- The cost to enter this position - and the maximum risk - is $1,250 (or roughly 7% of the cost of buying 100 shares of AAPL)
- The breakeven price (if we hold this position until option expiration) is $182.50 (strike price + option cost, i.e., 170 + $12.50 = $182.50) - above $182.50; the option position will gain a point for point with the stock position
- The position has a "Delta" of 79.14. This implies that the position is roughly equivalent to buying 79 shares of AAPL stock
- The position has a "Gamma" of 2.005. This implies that the position will gain roughly 2 Deltas for each $1 that AAPL share gains in price (or lose 2 Deltas if AAPL declines $1 in price)
- The position has a "Vega" of $18.85. This implies that for every point that implied volatility rises, this option position will gain roughly this amount of value
- The position has a "Theta" of -$5.81. This implies that the option position will lose this much value via the passage of one day due to time decay
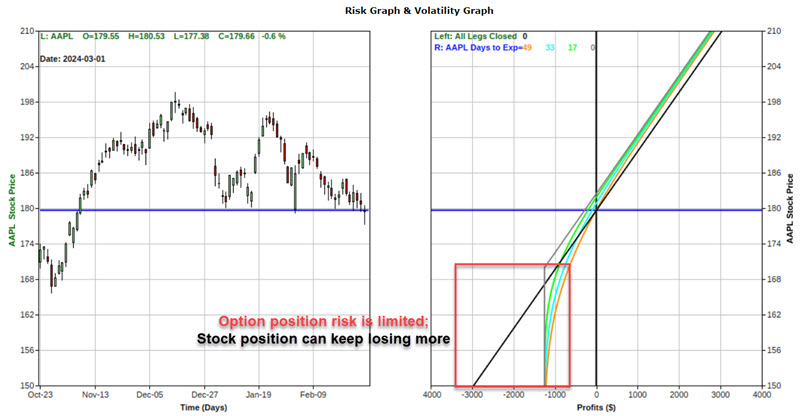
Possibly the best way to visualize this position is to compare its risk curves to those for a long 100 shares of AAPL position. This comparison appears in the chart below.
The key things to note in the chart above are:
- Above the breakeven price of $182.50, the option position will gain point-for-point with a position holding 100 shares of AAPL stock (despite costing only roughly 7% of the stock position)
- Below the option strike price of $170, the option position can lose no more than the $1,250 paid to enter the position, while the stock position will continue to lose another $100 for each $1 decline in the price of AAPL stock
A bearish play
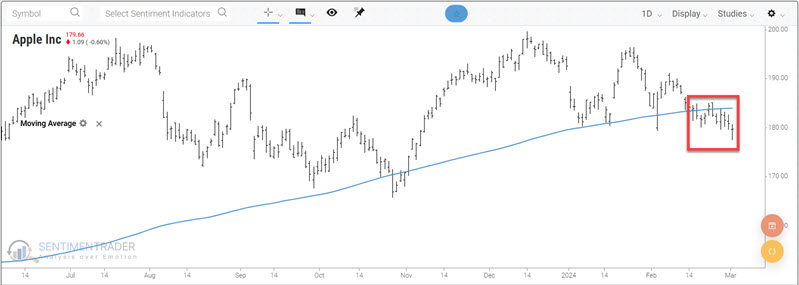
Some traders may look at the chart of AAPL prices below and see a stock breaking down below its 200-day moving average and conclude that AAPL shares are destined to fall further in the months ahead.
Let's consider a straightforward approach to playing this specific outlook. The example below essentially amounts to a "short stock replacement" position. Our bearish example involves:
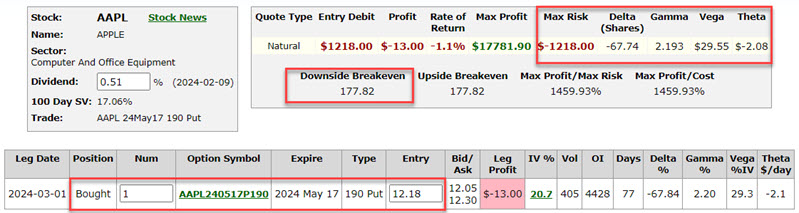
- Buying 1 AAPL April19 2024 190 put @ $12.18
The particulars for this position appear in the screenshot below.
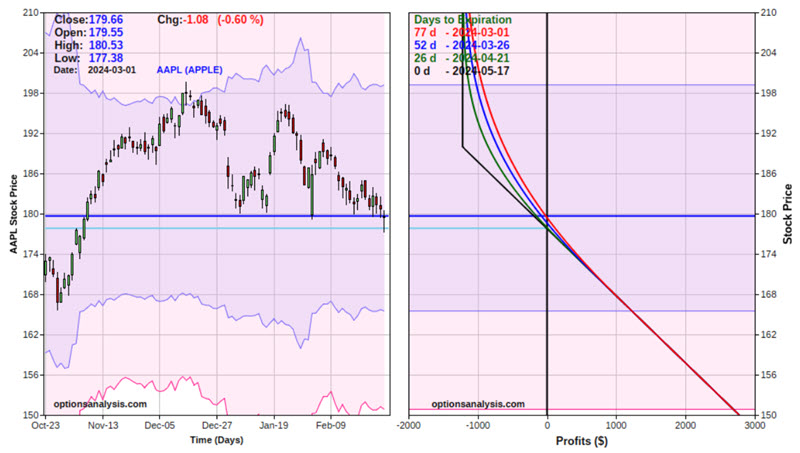
The risk curves (i.e., the expected $P/L for this position as of a given price for AAPL shares on different dates leading up to options expiration on April 19) appear below.
Things to note:
- The cost to enter this position - and the maximum risk - is $1,218
- The breakeven price (if we hold this position until option expiration) is $177.82 (strike price - option cost, i.e., 190 - $12.18 = $177.82) - below $177.82; the option position will gain point for point with each one-point decline in the price of AAPL shares
- The position has a "Delta" of -67.74. This implies that the position is roughly equivalent to shorting 68 shares of AAPL stock
- The position has a "Gamma" of 2.193. This implies that the position will gain roughly 2.2 Deltas for each $1 that AAPL share gains in price (or lose around 2.2 Deltas if AAPL declines $1 in price)
- The position has a "Vega" of $29.55. This implies that for every point that implied volatility rises, this option position will gain roughly this amount of value
- The position has a "Theta" of -$2.08. This implies that the option position will lose this much value via the passage of one day due to time decay
The chart below displays risk curves for the option position and the risk curve for a position short 100 shares of AAPL stock (the black line).
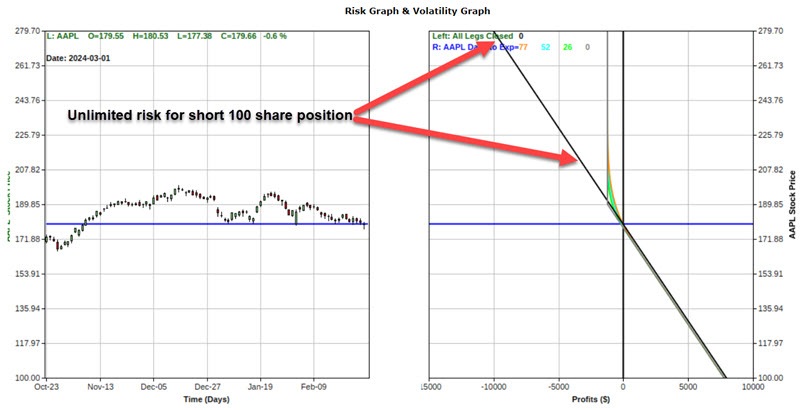
The key things to note in the chart above are:
- Below the breakeven price of $177.82, the option position will gain point-for-point with a position holding short 100 shares of AAPL stock
- On the upside, the short stock position entails unlimited risk, while the option position cannot lose more than the premium paid ($1,218)
What the research tells us...
We offer no opinion regarding how AAPL shares will move from here. But for a trader (particularly one without a large trading account), an option position can offer almost all of the profit potential of a position in the underlying shares (often at a fraction of the cost) while limiting risk to a specific amount.