
Betting big on AMZN (as cheaply as possible)

Key points
- Amazon just broke out to a new all-time high
- Let's consider one way to play for a follow-through to higher levels while simultaneously limiting dollar risk to a low level
- The strategy we will consider is referred to as a call calendar spread
Amazon joins the "breakout party"
The chart below shows that AMZN finally broke through to the upside to close at a new all-time high.
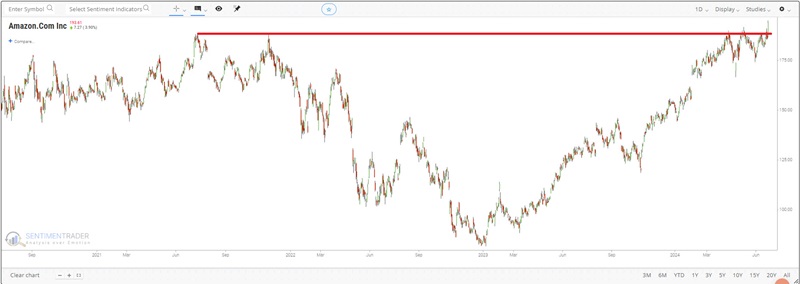
Does this mean AMZN is destined to rally to sharply higher levels? Not necessarily. However, standard technical analysis typically recognizes a breakout to a new all-time high as a potential "launching pad." For a bullish trader, buying 100 shares of AMZN stock is the most straightforward approach. However, the shares trading at $193.61 a share requires a capital outlay of $19,361.
Let's assume a scenario in which we want to bet on a continuation rally but are unsure of our conviction and certainly don't want to commit that kind of capital or assume much dollar risk.
Enter the Out-of-the-Money Call Calendar Spread
An Out-of-the-Money (OTM) call calendar spread involves buying a longer-dated call option with a strike price above the underlying stock's current price and simultaneously selling a shorter-dated call option at the same strike price.
For reasons we will explain in a bit, this strategy is best used when implied option volatility is low, i.e., when options are "cheap." The chart below (all charts below courtesy of www.Optionsanalysis.com) displays AMZN price action and the implied volatility for AMZN options (black line). As you can see, implied volatility is near the low end of the historical range.
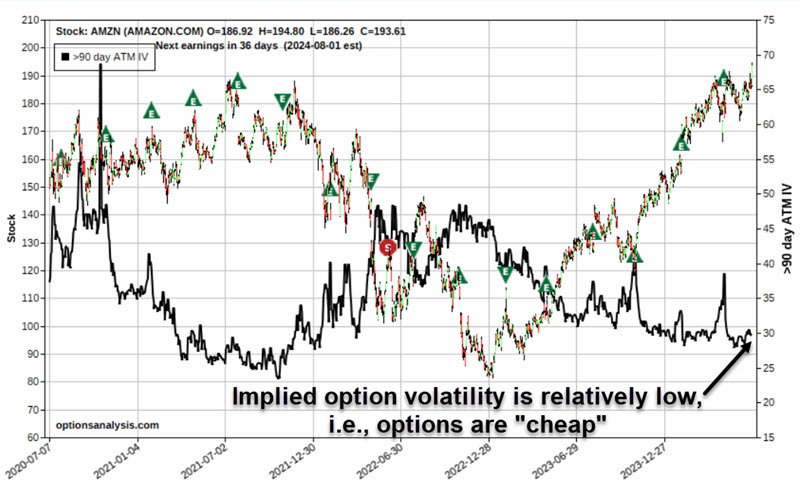
Implied volatility is calculated using an options pricing model (such as Black-Scholes). In simplest terms, the lower the IV, the less time premium is built into the price of that securities' options (i.e., options are "cheap"), and the higher the IV, the more time premium there is (i.e., options are "expensive").
Buying a calendar spread when IV is low:
- Allows us to buy options as cheaply as possible
- Offers the potential for gains if IV subsequently rises (thus inflating the amount of time premium built into the position)
- May insulate to some extent from the risk of a "volatility crush" - whereby the position loses time premium value if implied volatility collapses after the position is entered
An example AMZN options trade
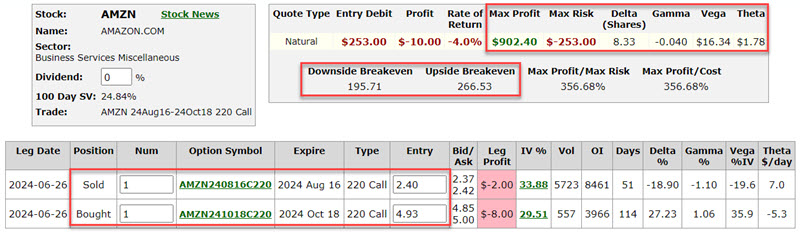
It is essential to point out that the example trade below is presented as an "example" and not as a "recommended trade." The trade we will examine involves:
- Buying 1 AMZN Oct18 2024 220 Call @ $4.93
- Selling 1 AMZN Aug16 2024 220 Call @ $2.40
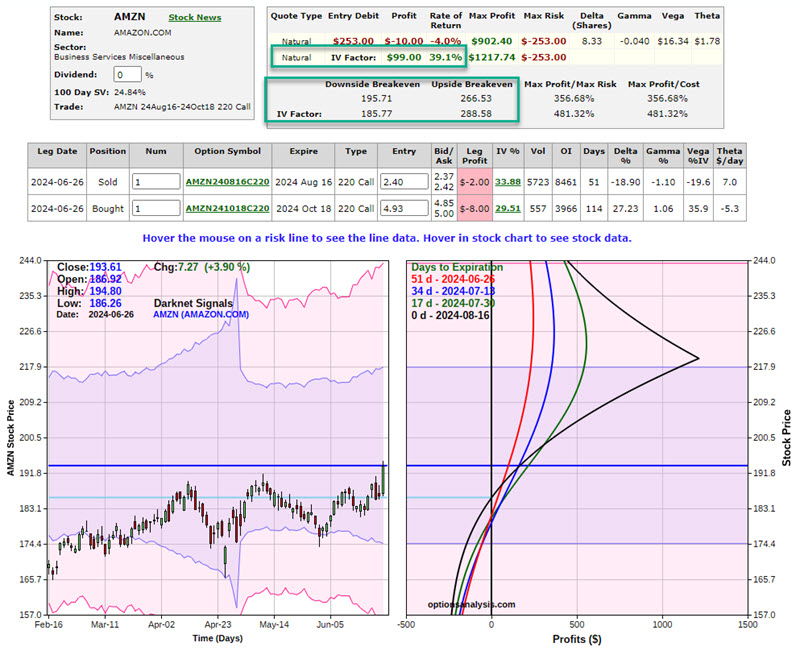
The particulars appear in the screenshot below.
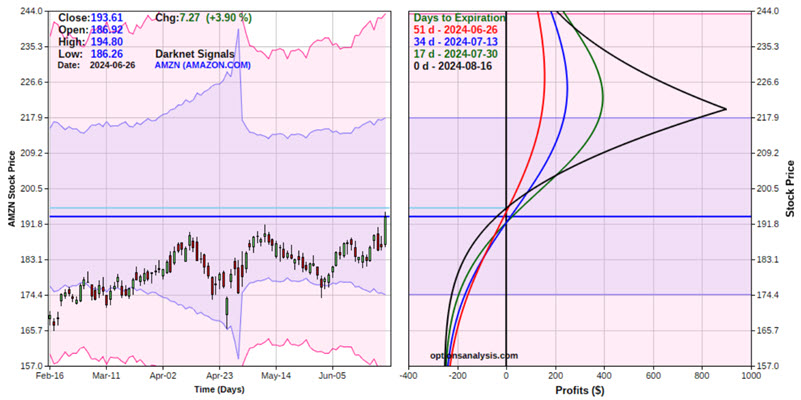
The risk curves (i.e., the expected $ profit or loss based on the price of AMZN shares as of a given date) appear in the chart below. The trade offers significant potential percentage profit if the stock rises in price and limited dollar risk if the stock declines in price.
Things to note:
- The total cost to enter this trade (using a 1-lot) is $253. This also represents the maximum worst-case dollar loss
- Based on current IV levels, this position will generate a profit at August expiration if AMZN is between $195.71 and $266.53
- Note that the risk curves "roll over" if the price exceeds the strike price of $220 a share
- The position has a "Delta" of 8.33: This value can and will change as the price moves. However, for now, the implication is that this position will gain or lose $8.33 for each $1 change in the price of AMZN shares
- The position has a "Vega" of $16.34: This implies that for each one-point change in implied volatility, the position will gain $16.34 in value, and vice versa (i.e., the position will benefit from an increase in implied volatility)
- The position has a "Theta" of $1.78: This implies that the position will gain $1.78 in value due solely to the passage of one day (like other "Greek" values, this will change over time)
If AMZN shares were to reach the strike price of $220, this option position could generate an open profit of $150 to roughly $900, depending on whether the move is immediate or takes longer to play out.
Managing the Position
The first question is determining lot size. A simple approach to determining lot size is as follows:
A = Trading account size
B = % of trading capital account size to risk
C = A * B
D = Position cost ($253)
Lot size = C / D
So, for example, let's assume a trader has a $50,000 trading account and is willing to risk up to 2%:
A = $50,000
B = 2%
C = $50,000 x 2% = $1,000
D = $253
Lot Size = $1,000 / $253
So, if a trader were to buy a 4-lot, they would commit and risk $1,012, or just a shade over 2%
The outlook for this position is evident from the risk curve chart above:
- If AMZN shares decline in value, this position will almost certainly lose money
- If AMZN shares rise towards $220 a share, this position can generate a significant percentage profit
- If AMZN shares rise beyond $220 a share, the level of profit will begin to decline
A trader should decide in advance if there is some point at which they will abandon the trade if the breakout fails to hold or whether to give it some time to play out.
On the upside, the only hard and fast rule is to close or adjust the position if AMZN shares approach the strike price of $220 (since the profit level would begin to decline if AMZN shares move above that price).
Another part of the plan might be to exit or adjust the position if a certain percentage or dollar level of profit is reached and/or if the trade can be adjusted to lock in a profit while still holding on for additional potential profits.
Call Calendar Spread versus Long Shares of AMZN
We mentioned above that the example option position has a Delta of 8.33. This suggests that the position is roughly equivalent to buying eight shares of AMZN. The chart below displays the comparative risk curves for:
- Black line = AMZN 220 Call calendar spread (at expiration)
- Grey line = Long eight shares of AMZN stock
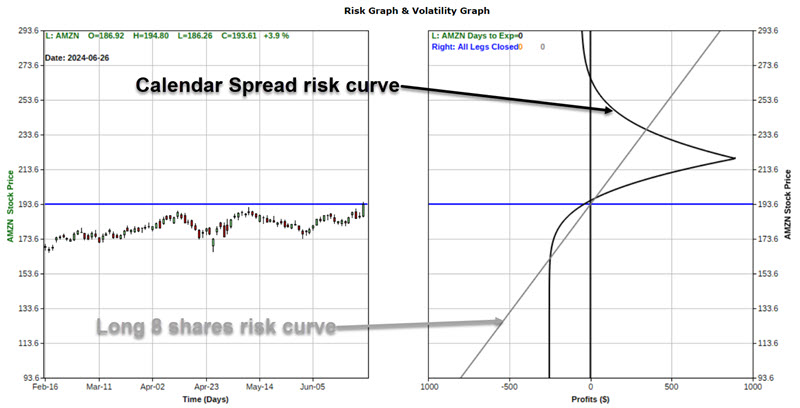
There are some noticeable and significant differences and tradeoffs:
- Above roughly $237 a share, the long shares position is better
- Between roughly $196 and $237 a share, the calendar spread has more significant profit potential (the reason for selecting this trade is the expectation that AMZN will trade somewhere in that range before August expiration)
- Between roughly $165 and $196, the calendar spread (barring an increase in implied volatility - which we will discuss in a moment) would likely lose more money than holding long shares of stock
- Below roughly $165, the maximum risk for the calendar spread is $253, while the shares position will continue to lose $8 for every point at which AMZN stock declines.
Call Calendar Spread if volatility changes
As detailed earlier, the current implied volatility for AMZN options is relatively low. What would happen if IV changes during the life of this position? First, note that the longer-dated October 220 call has a "Vega" of $35.9, and the shorter-dated August 220 call has a "Vega" of -$19.6. This means that the long call would gain more based on an increase in volatility than the short option would lose. Bottom line: this position would benefit from an increase in implied volatility during the life of the trade.
The chart below displays the risk curves if implied volatility rose 30% from current levels.
Note that a 30% increase in implied volatility would be expected to add roughly $99 to the value of a 1-lot position (again because the call we hold long would gain more time premium than the call we hold short).
Also, note that the breakeven range would expand from $195.71 and $266.53 to $185.77 and $288.58. In other words, an increase in implied volatility would increase our probability of profit.
Let's look at the position if IV declines 20% after the trade is entered. The chart below displays the risk curves if implied volatility declined 20% from current levels.
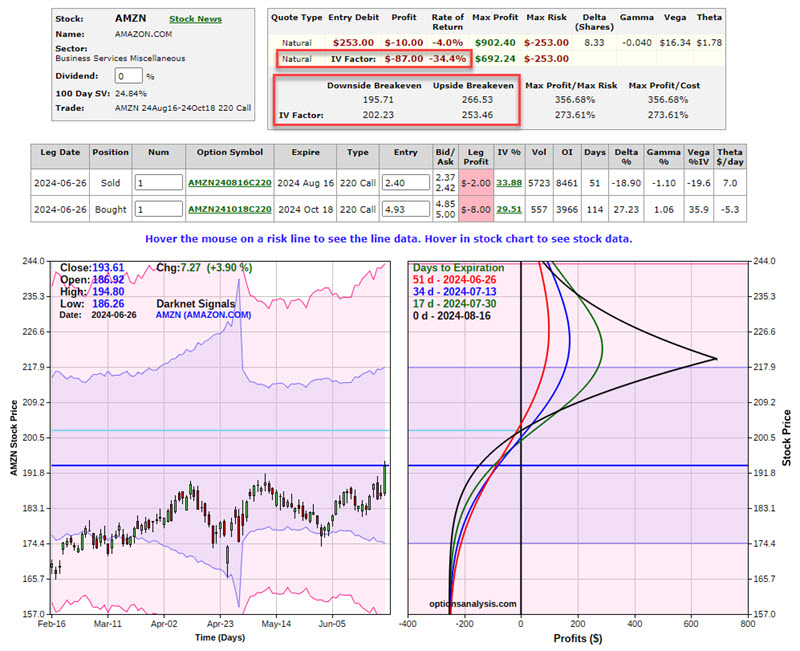
Note that a 20% decrease in implied volatility would be expected to decrease the value of a 1-lot position by roughly $87 (because the call we hold long would lose more time premium than the call we hold short).
Also, note that the breakeven range would narrow from $195.71 and $266.53 to $202.23 and $253.56. In other words, an increase in implied volatility would decrease our probability of profit.
What the research tells us…
An OTM call calendar spread could make sense for a trader who believes that the breakout in AMZN shares will follow through but does not have a high conviction and/or is not willing to risk more than a certain amount of capital. The example trade above could also make sense for a trader who thinks that $220 a share is a reasonable upside target. The keys to using a call calendar spread are to fully understand the nature of the risk curves and how the position will react to changes in price and volatility and also to have a trade management plan detailing what to do - if anything - if the price rises or falls by a meaningful amount.