Products
SentimenTrader Trading Tools
‍
Backtest Engine
My Trading Toolkit
Correlation Analysis
Seasonality
Indicators & Data API
‍
Proprietary Indicators & Charts
Market Data API
Strategies & Scanner
‍
50+ Trading Strategies
Smart Stock Scanner
Research Reports
‍
Research Solutions
Reports Library
Free Resources
Simple Backtest Calculator
Simple Seasonality Calculator
The Kelly Criterion Calculator
Sentiment Geo Map
Public Research Reports
Pricing
Company
About
In the News
Testimonials
Client Success Stories
Contact
Log inLoginSign up
< BACK TO ALL REPORTS

Best-Ever Retracement; VIX Is Awfully Low

Jason Goepfert
2019-01-10
null

This is an abridged version of our Daily Report.

Best-ever retracement

Two weeks into a recovery from a major decline, the S&P 500 has made back more than 40% of its losses. If we go back to 1928 and look at every time the S&P declined more than 15% from a multi-year high within a year’s time, then rallied for at least two weeks, we can compare how much of the decline each of them retraced. Out of 29 such attempts, the one we’re seeing right now comes out on top.

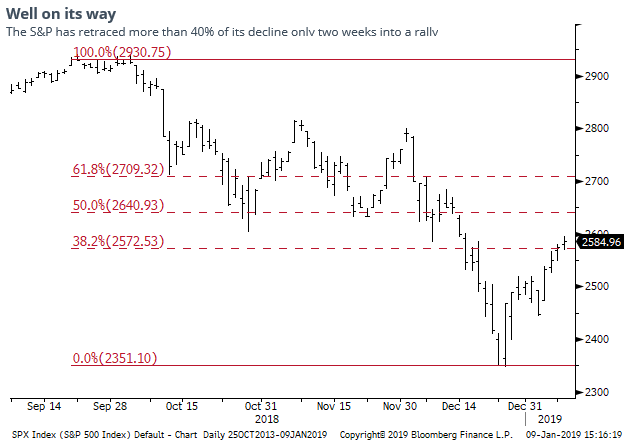
Other quick, large retracements led to much better longer-term returns than those rally attempts that were weaker and retraced less of the decline initially. In the next six months following the strongest retracements, the S&P 500 averaged a return of +10.0%. After the weakest, it averaged a lowly -5.4%. 

Sigh of relief

The VIX “fear gauge” has dropped dramatically as options traders price in a much reduced level of volatility going forward. But the S&P 500’s actual volatility remains high.

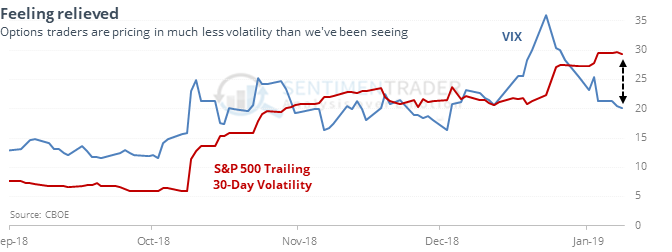
The spread between the two is now among the widest since 1990, and other times it got this wide, stocks mostly struggled going forward.

Four in a row

The S&P 500 fund, SPY, has rallied four days in a row while below its 200-day average, with today’s gain being the smallest of the four. That has led to more gains over the next three days only 3 out of 11 times, averaging -1.3%.

Wow

This is just further confirmation from other thrusts we've shown in the past few days, but the 10-day average of Up Volume has now reached 70%. According to the Backtest Engine, there have been 46 days since 1962 when it was this high. A year later, the S&P 500 was higher 43 times.

PRODUCTS
SentimenTrader
Trading Tools
Indicators & Data API
‍
Strategies & Scanner
‍
Research Reports
FREE
RESOUrCES
Simple Backtest
Calculator
Simple Seasonality
Calculator
The Kelly Criterion
Calculator
Sentiment Geo Map
‍
Public Research Reports
‍
Pricing
Bundle pricing
‍
Announcements
‍
FAQ
COMPANY
‍
About
‍
In the News
‍
Testimonials
‍
Client Success Stories
CONTACT
‍
General Inquiries
‍
Media Inquiries
‍
Financial Professionals Inquiries
‍
© 2025 Sundial Capital Research Inc. All rights reserved.
Setsail Marketing
TermsPrivacyAffiliate Program
Risk Disclosure: Futures and forex trading contains substantial risk and is not for every investor. An investor could potentially lose all or more than the initial investment. Risk capital is money that can be lost without jeopardizing ones’ financial security or life style. Only risk capital should be used for trading and only those with sufficient risk capital should consider trading. Past performance is not necessarily indicative of future results.

Hypothetical Performance Disclosure: Hypothetical performance results have many inherent limitations, some of which are described below. No representation is being made that any account will or is likely to achieve profits or losses similar to those shown; in fact, there are frequently sharp differences between hypothetical performance results and the actual results subsequently achieved by any particular trading program. One of the limitations of hypothetical performance results is that they are generally prepared with the benefit of hindsight. In addition, hypothetical trading does not involve financial risk, and no hypothetical trading record can completely account for the impact of financial risk of actual trading. for example, the ability to withstand losses or to adhere to a particular trading program in spite of trading losses are material points which can also adversely affect actual trading results. There are numerous other factors related to the markets in general or to the implementation of any specific trading program which cannot be fully accounted for in the preparation of hypothetical performance results and all which can adversely affect trading results.

Testimonial Disclosure: Testimonials appearing on this website may not be representative of other clients or customers and is not a guarantee of future performance or success.