
Before we bail out on energy...

Key Points
- After a terrific run of +308% from the Covid panic low to the June 2022 high, the energy sector has hit a severe air pocket in recent weeks
- We highlighted some of the concerns recently - most notably, insider selling and a weaker seasonal trend
- The "Energy is Dead" chorus seems to already be at full volume
- Before investors completely throw in the towel on energies, there are a variety of potentially favorable signals to consider
Some earlier concerns come to fruition
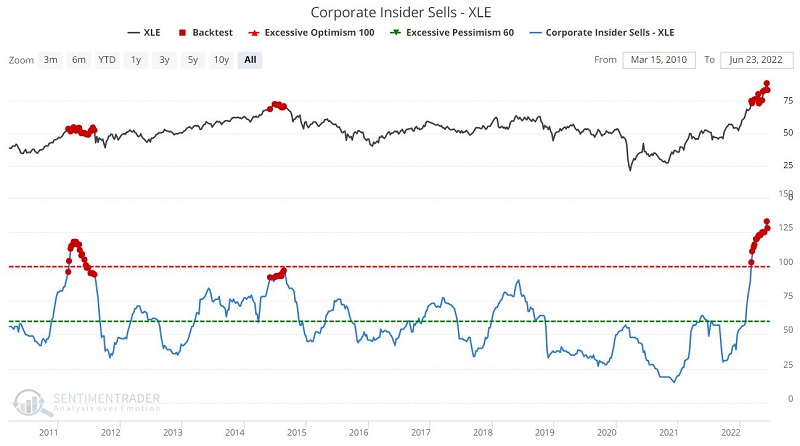
This recent article highlighted heavy selling among energy company insiders. As you can see in the chart below, this remains a concern.
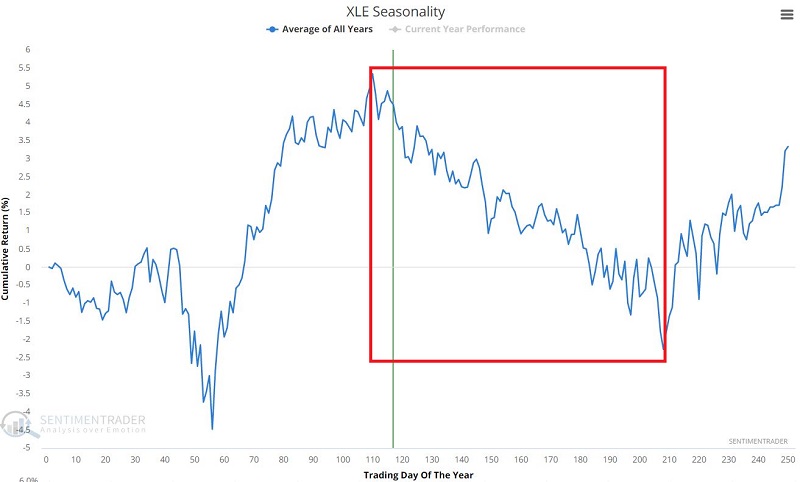
The energy sector is also in the early stages of an annual seasonal period that tends to see weakness. However, it is important to remember that results can vary widely from year to year.
So, some factors foreshadowed weakness in the energy sector and remain negative. The recent plunge in energy products and related stocks has produced a wide swath of negativity. But before assuming that "it's all over" for energy, an investor should also consider a variety of factors that suggest that maybe "energy is not dead yet."
XLE % Below Bollinger Bands
The figures below display those times when the % of stocks that comprise ticker XLE that were below their respective Bollinger Bands was equal to 100% and the subsequent performance.
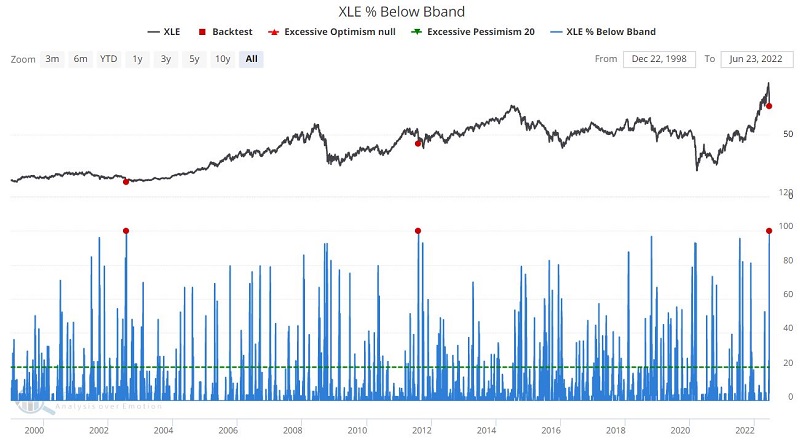
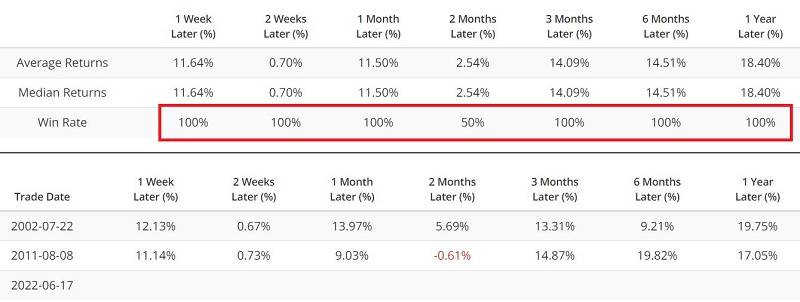
This is an exceptionally small sample size, so we should not get too carried away about all of the 100% Win Rates. Still, at the very least, it constitutes a potentially positive development as an opening salvo.
XLE 4-Week Low %
The figures below display those times when the % of XLE stocks reaching a recent 4-week low was equal to 100% and the subsequent performance.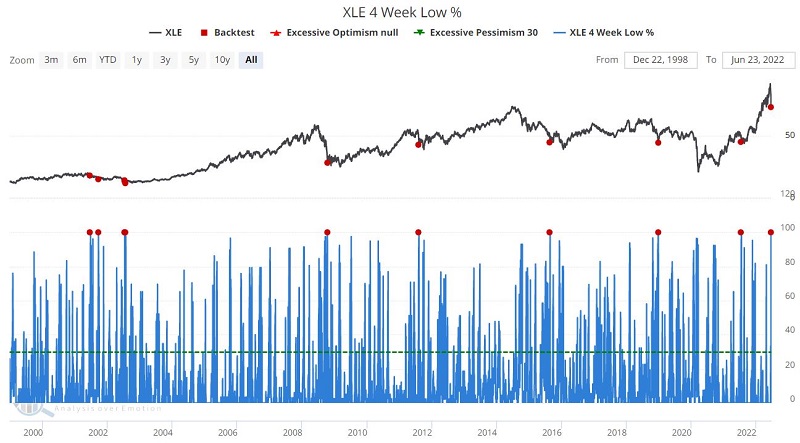
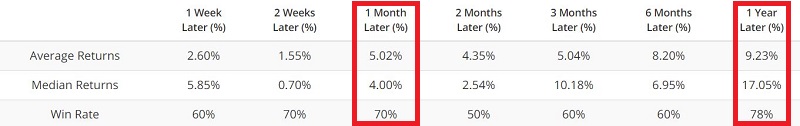
The results are mixed but tilt positive. The best results have been in the 1-month and 1-year timeframe.
XLE Optix
The figures below display those times when the XLE Optix was below 5% while XLE was above its 200-day moving average and the subsequent performance.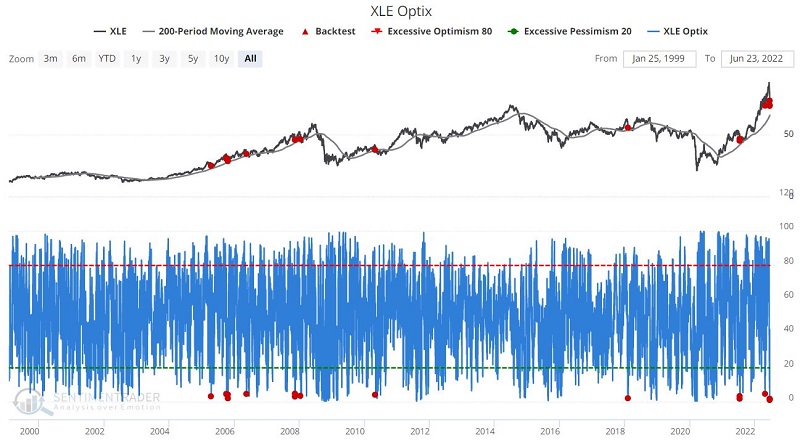
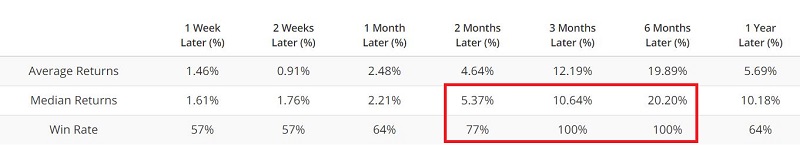
The best results have been in the 2-month to the 6-month timeframe.
XLE Breadth (> 50-day Avg)
The figures below display those times when the % of XLE stocks above their respective 50-day moving average was equal to 0, while XLE was above its 200-day moving average and the subsequent performance.
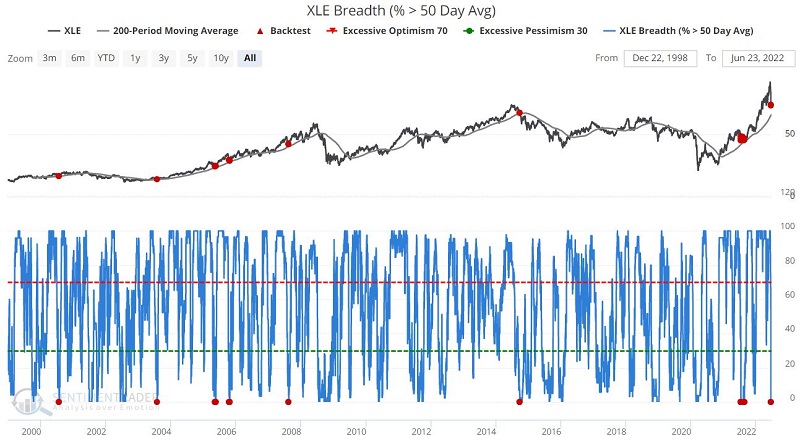
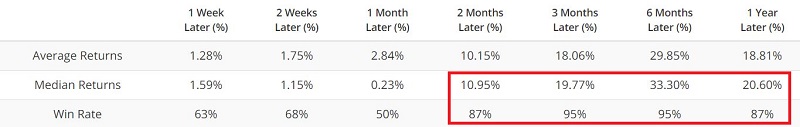
The best results have been in the 2-month to the 6-month timeframe.
XLE McClellan Oscillator
The figures below display those times when XLE McClellan Oscillator dropped below -200 and the subsequent performance.
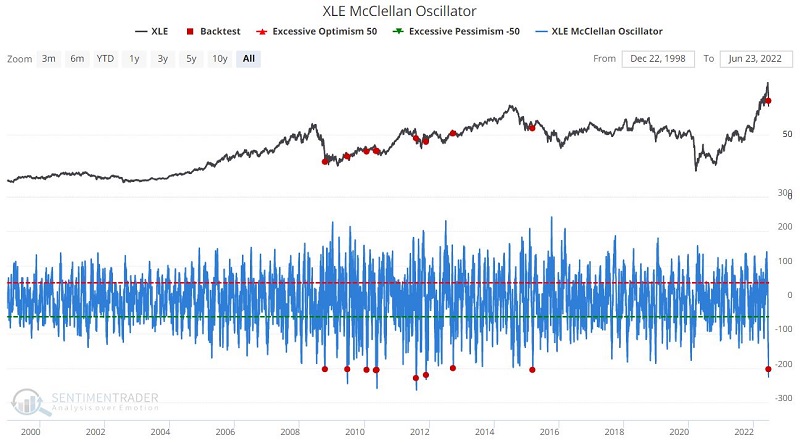
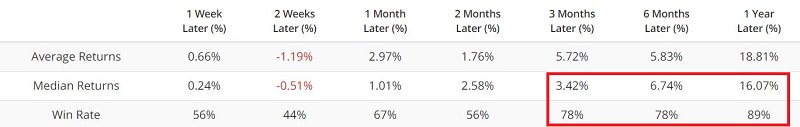
The best results have been in the 6-month to 12-month timeframe.
What the research tells us…
Almost overnight - well, over a few weeks anyway - the narrative has gone from "energy is the only place to be" to "RUN!" as energy products and energy stocks have plummeted in price. Is the best over for energy? In a sense, the answer is "almost certainly." It would be hard for even the most optimistic trader to envision the energy sector gaining another 300% of the next two and a quarter years - as it did in the past two and a quarter years.
But investors are on something of a hair-trigger these days, and a vicious decline such as we've seen in XLE (-23% in just ten trading days) unsurprisingly inspires fear. Is it possible that fossil fuel prices have finally peaked once and for all and that the traditional energy sector XLE represents will struggle going forward? Absolutely. Nevertheless, investors are encouraged to consider the evidence above before concluding that the "good times" are entirely over for the energy sector.