
Bad and good in the gold sector - Part II

Key points
- The good news is that specific indicators have flashed some very favorable signals for gold
- In Part I, we covered the bad news - that several indicators are flashing very unfavorable signals for gold stocks in the short-term
- In this piece, we highlight the continued longer-term upside potential for gold futures
Price action and seasonality offer something of a tailwind
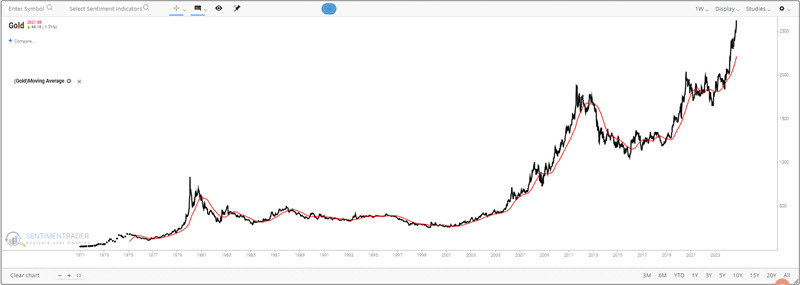
The chart below displays a weekly bar chart for gold futures. Gold is clearly in a powerful uptrend. Most traders are trying to decide if gold will "go parabolic" (i.e., explode exponentially higher) or run out of steam and suffer a pullback.
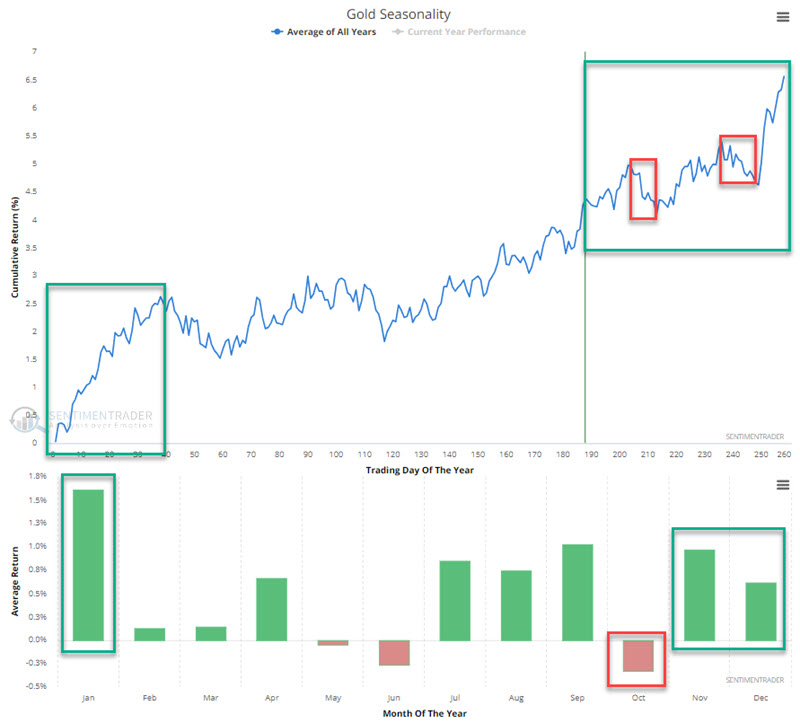
The chart below displays the annual seasonal trend for gold futures. There are a couple of periods of potential weakness in the months ahead; however, overall, the seasonal trend remains positive between now and late February 2025.
On a trend-following basis, there is little reason (other than fear of a pullback from an overbought condition) not to favor the bullish case.
The Copper/Gold Relative Ratio Rank plummets
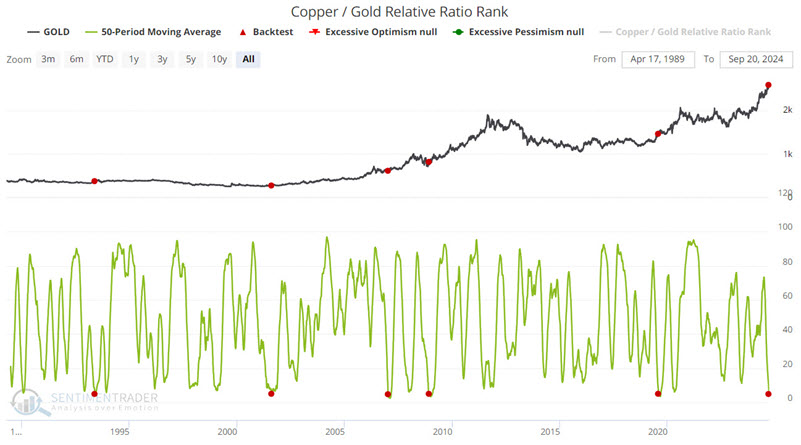
The Copper/Gold Relative Ratio Rank indicator shows where the ratio is relative to its range over the past four months. When the relative ratio is high, investors are showing risk-on behavior. When the ratio drops to a low level, they exhibit risk-off behavior. This tends to be favorable for gold as more investors move aggressively into more speculative areas such as precious metals.
The chart below highlights those dates when the 50-day average of the Copper/Gold Relative Ratio Rank crossed below 5 for the first time in three months.
The table below summarizes gold performance and signal-by-signal results.
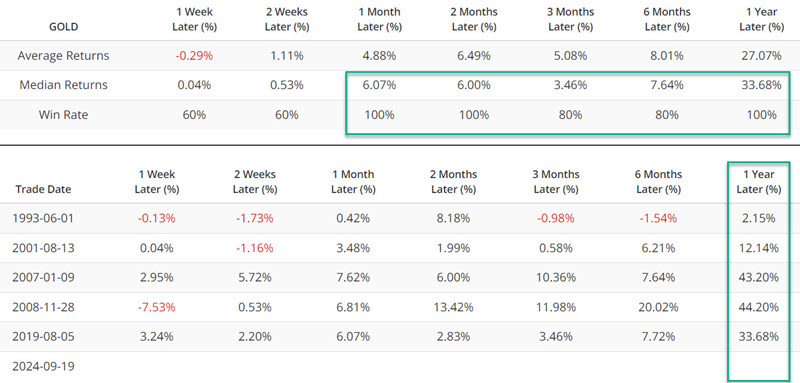
A 1-Year Win Rate of 100% and Median Return of +33% is compelling. That said, the sample size is small, the 1993 signal saw a 1-year gain of just over 2%, and there are never any guarantees with any indicator signal. Still, it does provide some reason to continue to give the bullish case for gold the benefit of the doubt.
Hedgers position in gold may offer a clue
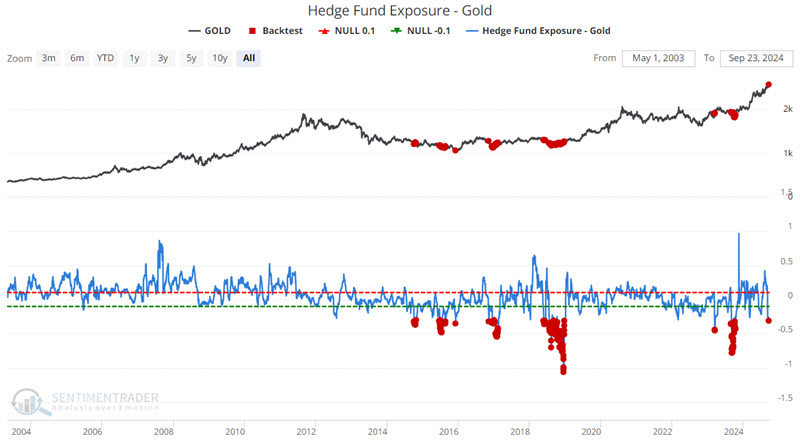
The Hedge Fund Exposure - Gold indicator is based on a composite of hedge fund tracking indexes. It compares this index of hedge fund exposure against returns in gold futures to see how much exposure hedge funds appear to have to the gold market. If they are highly exposed, the index will rise more than gold and vice versa. We generally see that when funds are heavily exposed to gold, the market is in danger of stalling out or falling as these funds retrench. When under-exposed, gold may see buying pressure come in as funds add exposure. At the moment, hedge fund exposure is at a significantly low level.
The chart below highlights all dates when this indicator was below -0.3.
The table below summarizes subsequent gold futures performance.
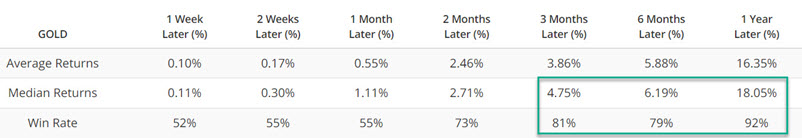
Note that this signal should not be used as a standalone trading model but does lend weight to the bullish case as a weight of the evidence indicator.
What the research tells us…
In Part I, we highlighted some serious concerns for gold mining stocks. Meanwhile, in Part II, things look still favorable for gold bullion. Is it possible - or likely - that gold can hold up well or advance while gold miners take a hit? Anything is possible. The real question is, "What is most probable." The long-standing theory is that if gold bullion performs exceptionally well, eventually, gold stocks will "catch up" (assuming they don't lead, which they certainly have not done this time around). So, there are two scenarios to watch for:
1) Gold bullion continues to perform well, and gold stocks shrug off their tendency for October weakness and "join the party" meaningfully.
2) Gold and gold stocks suffer a period of weakness (most likely - historically speaking - during October), with gold stocks suffering the worst (again, historically speaking).