
Bad and good in the gold sector - Part I

Key points
- The good news is that certain indicators have flashed some very favorable signals for gold, and gold is in an established uptrend
- The bad news is that several indicators are flashing very unfavorable signals for gold stocks in the short-term
- In this piece, we highlight the near-term potential negatives for gold mining stocks
Seasonality casts a long shadow on gold stocks
While I pay more attention to seasonality than most, I acknowledge that it is not a "trading" signal but merely a tool to guide me as to "when to look where." On that basis, it is fair to look askance at gold stocks presently.
The chart below displays the annual seasonal trend for The Gold Bugs Index (ticker HUI). We use HUI instead of ticker GDX because HUI (an index of gold mining stocks) has data from 1957, allowing for much more comprehensive testing than GDX, which started trading in 2006.
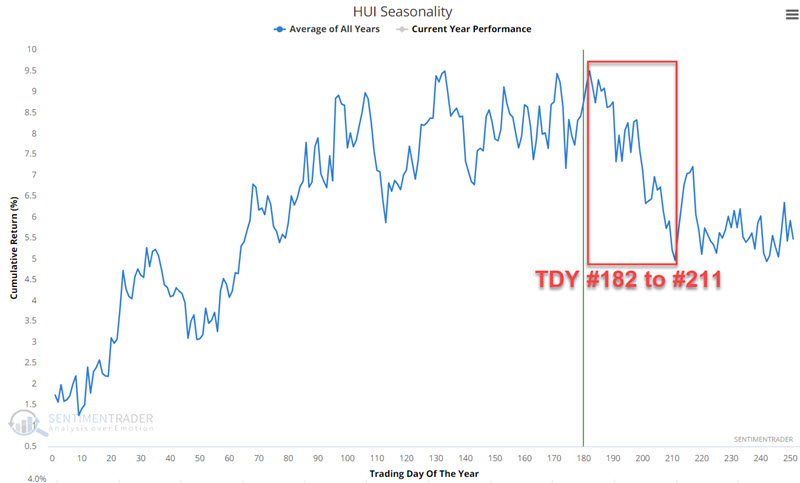
We see a period of seasonal weakness that extends from Trading Day of Year (TDY) #182 through #211. For 2024, this period extends from the close on 2024-09-20 through 2024-10-31.
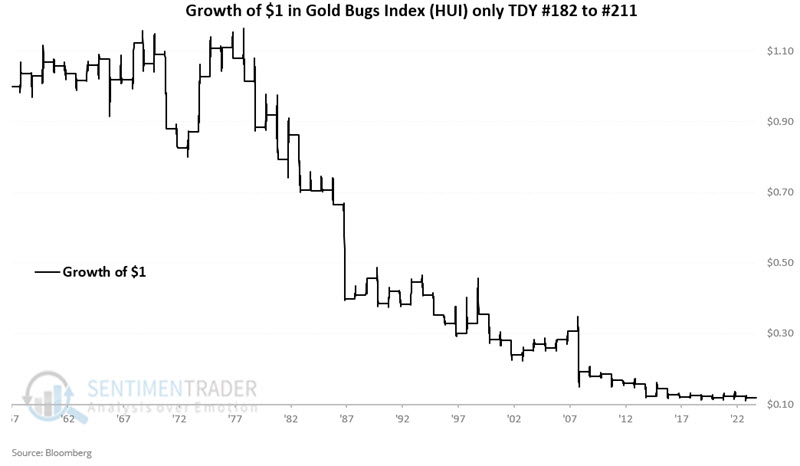
The chart below displays the hypothetical growth of $1 invested in ticker HUI only from TDY #182 through #211 every year since 1958. The net result is a cumulative hypothetical loss of -88%.
The chart below displays the same results on a logarithmic scale.
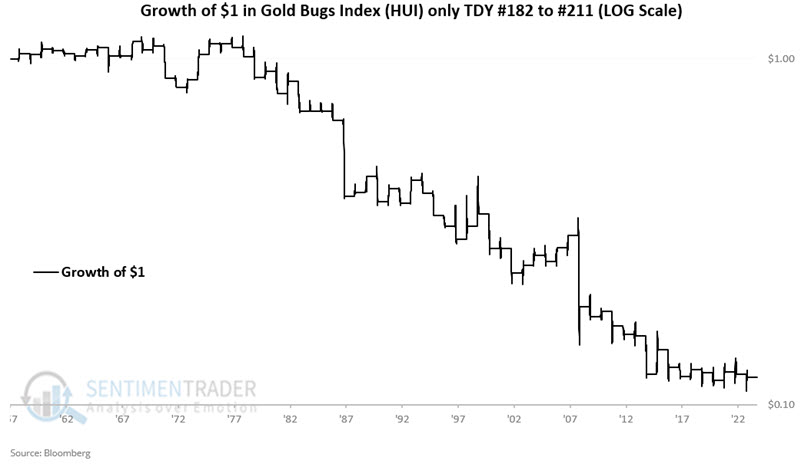
Here is where it gets complicated. A cumulative loss of -88% combined with the steady upper-left to lower-right nature of the equity charts above suggests that gold stocks should be avoided during this period.
That said, note in the table below:
- During 45% of the years, HUI showed a gain during this period
- Five times, HUI showed a gain of +10% or more
- One year (2015) witnessed a +21.5% gain for HUI
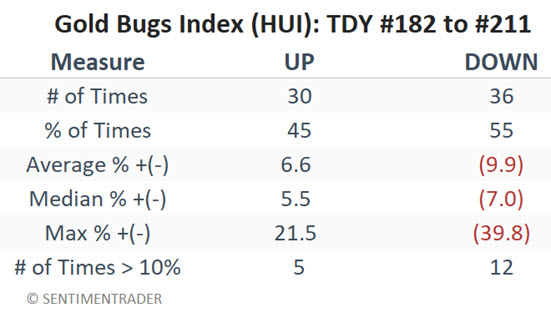
The message here is not that gold miners are doomed to fall in the month or so ahead. The message is that investors and traders need to carefully consider how much capital - if any - they want to allocate to gold miners during this time. Before answering that question, there are a few other factors to consider.
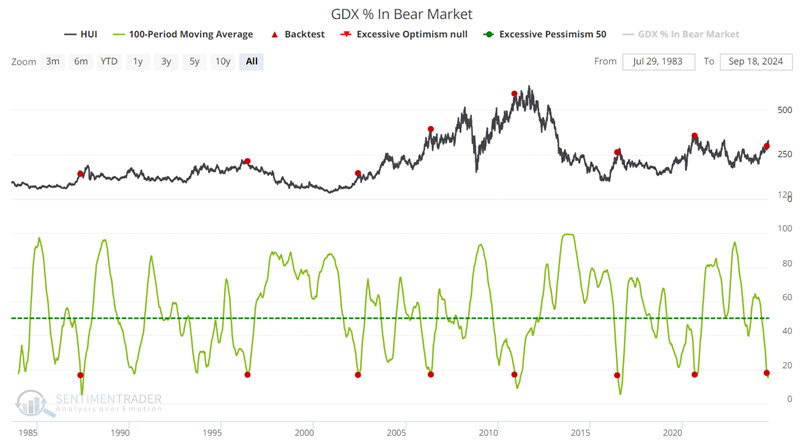
GDX % in Bear Market plunges to a low level
Our GDX % in Bear Market indicator shows the percentage of the GDX ETF components that are trading more than 20% below their 52-week highs. Intuitively, having a low level of gold stocks in a bear market would seem to be a good thing. And as a backward-looking indicator, that would be true. However, gold stocks have a somewhat sketchy history of being highly volatile and very prone to reacting sharply to overbought or oversold situations.
The chart below highlights those rare occasions when the 100-day moving average of GDX % in Bear Market crossed below 17%.
The table below summarizes HUI performance and signal-by-signal results.
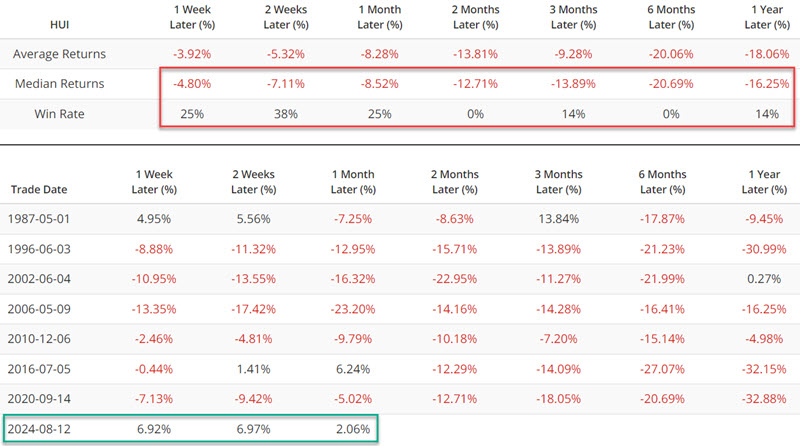
The table above shows both bad news and good news. The bad news is the dreadful historical results across the board. The good news is that since the most recent signal on 2024-08-12, gold stocks have seriously defied the historical averages and advanced. Still, for now, this one must be placed on the unfavorable side of the weight of the evidence ledger for gold stocks.
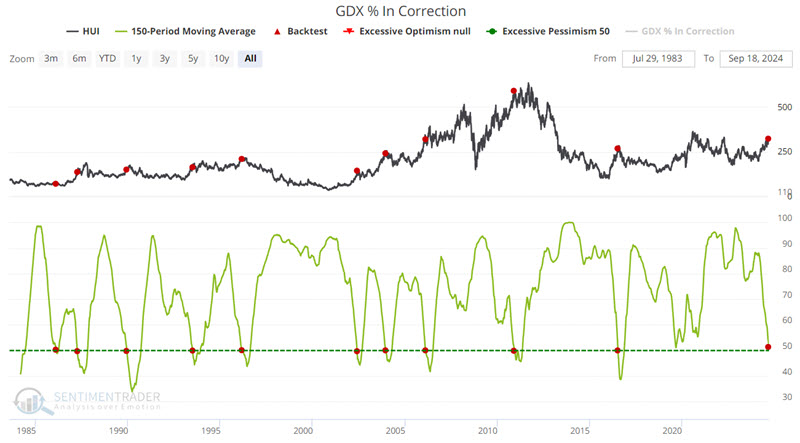
GDX % in Correction also falls sharply
Our GDX % in Correction indicator shows the percentage of the GDX ETF components trading above that are trading more than 10% below their 52-week highs. The chart below highlights those dates when the 150-day moving average of GDX % in Correction crossed below 50%. The most recent signal occurred on 2024-09-17.
The table below summarizes HUI performance and signal-by-signal results.
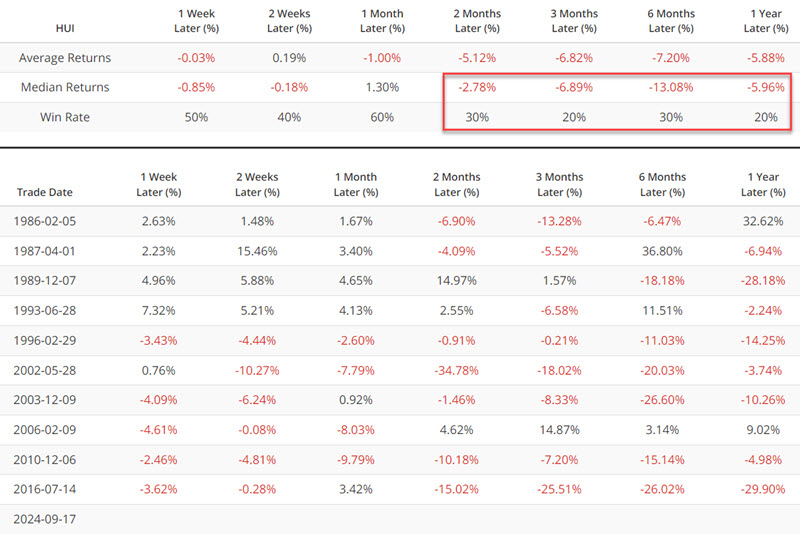
This one, too, must be placed on the unfavorable side of the weight of the evidence ledger for gold stocks.
The percentage of gold stock in an uptrend reaches an extreme
Our GDX Breath (%>200-day) indicator shows the percentage of the GDX ETF components trading above their 200-day moving averages. The chart below highlights all dates when this percentage was 94% or higher.
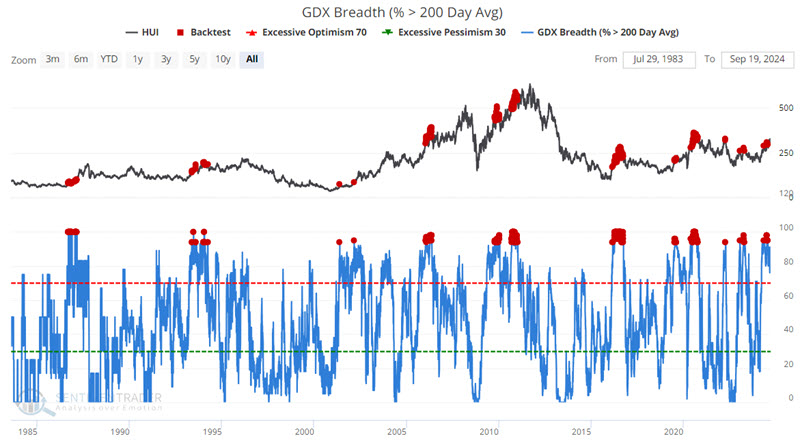
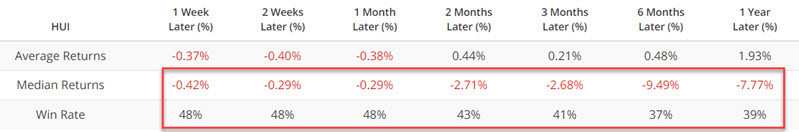
This condition should not be viewed as an automatic "sell" or "sell short" signal. It is more of a warning sign. Note that this condition is often reached well before an actual top in gold stocks; i.e., it sometimes takes a while for the sector to run out of steam. The table below summarizes HUI performance following the dates highlighted in the chart above (including all overlapping signals). Again, we see a tendency for losses and below-average Win Rates across the board.
What the research tells us…
The good news is that gold stocks are presently in a strong price uptrend (HUI is well above a rising 200-day moving average and 61% above its February 2024 low). The bad news is that the sector appears to be reaching a frothy level that has foreshadowed trouble in the past and is entering a period of potentially significant seasonal weakness. Those currently riding the bullish trend in gold stocks might consider tightening their trailing stops. All others might consider allocating capital elsewhere (including, potentially, to gold the metal) for the time being.
Before throwing in the towel entirely on all things gold, stay tuned for Part II.