
Australia triggers a new relative strength index buy signal

Key points:
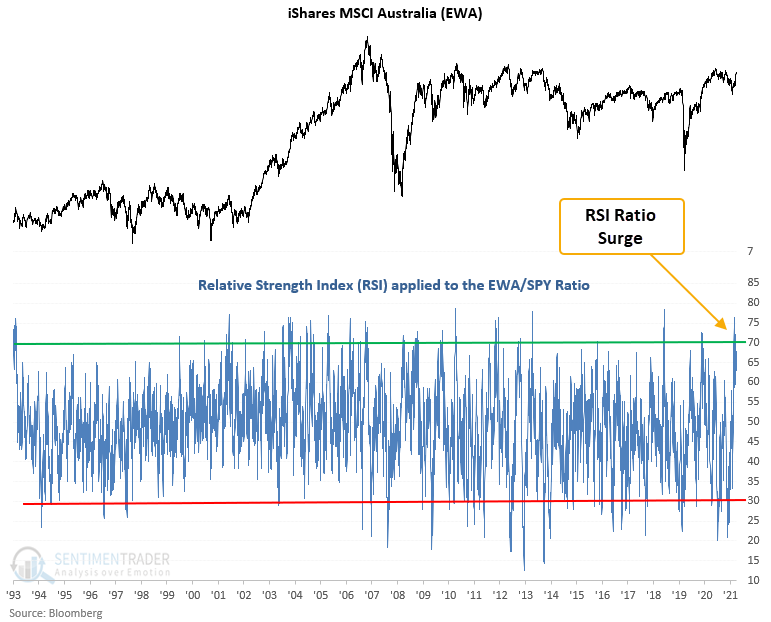
- The Relative Strength Index (RSI) applied to the EWA/SPY ratio surged above 70
- The RSI ratio surge reversed my relative trend model from negative to positive
- A trading model that uses the RSI indicator for absolute and relative trends triggered a new buy signal
- The EWA ETF has rallied 80% of the time after other signals
The Relative Strength Index (RSI) indicator
The relative strength index (RSI), developed by J. Welles Wilder Jr., measures price momentum for stocks, indexes, or other assets. However, one can apply the indicator to almost any type of time series. I like to use the RSI indicator on the ratio between two securities to identify relative strength trends. When the RSI ratio exceeds 70, the relative momentum trend is positive. Conversely, the relative momentum trend is negative when the RSI ratio falls below 30. I view an overbought signal as a positive development, which runs counter to conventional wisdom amongst most traders. i.e., positive momentum begets more positive momentum.
The RSI ratio indicator for the Australian ETF (EWA) surged to the third-highest level in the last decade.
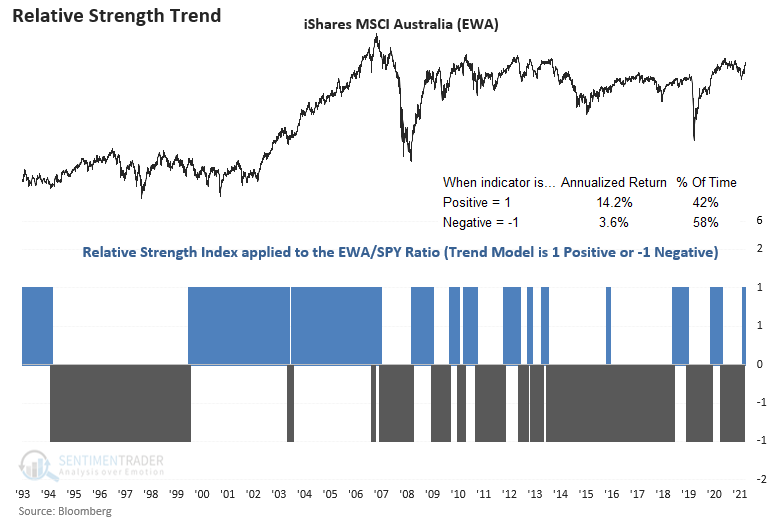
The Relative Strength Index (RSI) ratio trend for the iShares MSCI Australia ETF
My RSI ratio trend model reversed from negative to positive on 2/17/22 when the RSI ratio crossed above 70. Favorable RSI ratio trend conditions show significantly higher annualized returns for the iShares EWA ETF, with a return of 14.2%. In contrast, when the RSI ratio trend is negative, the ETF annualizes at 3.6%.
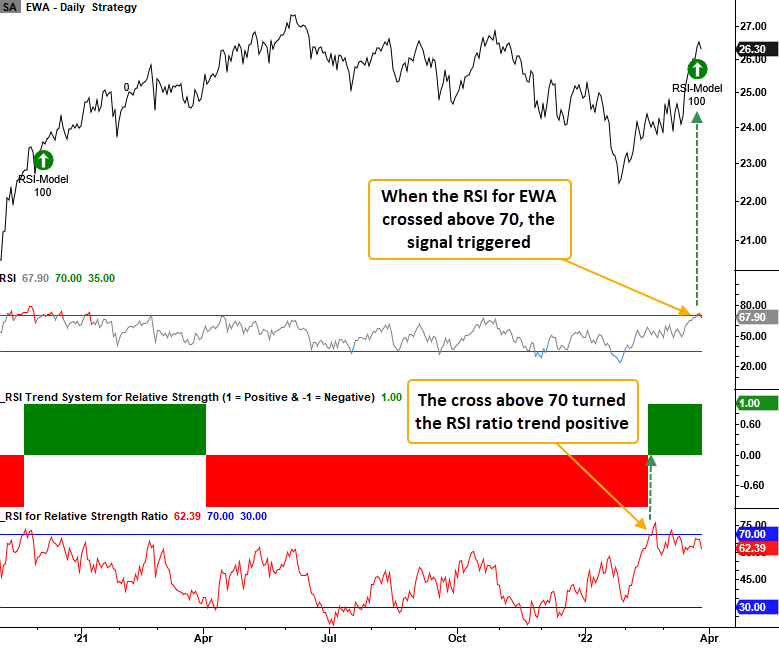
How the trading model works
The RSI trading model is simple. When the RSI ratio trend is positive, the model generates a new buy signal when the RSI indicator for the underlying stock or ETF crosses above 70. At the same time, the 5-day rate of change must be positive. I use a reset to screen out duplicate signals by requiring the RSI to fall below a user-defined level before a new alert can trigger again. The RSI condition ensures that we buy solid absolute and relative trends. I want to avoid buying the best house in a lousy neighborhood. i.e., relative winners in protracted downtrends.
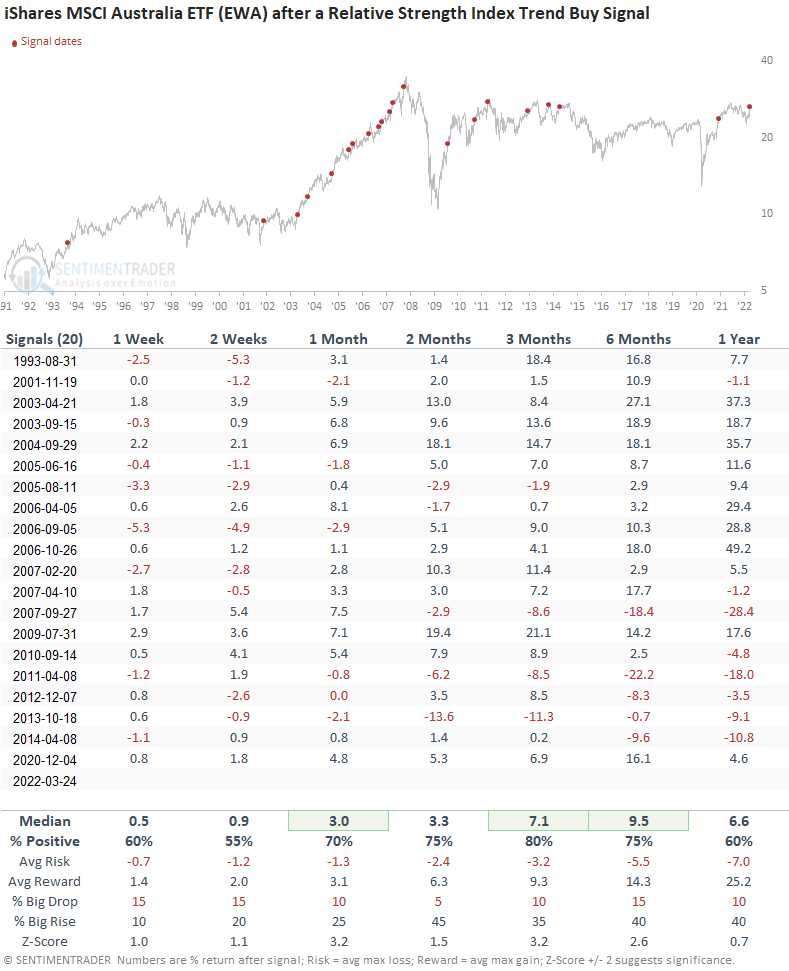
Similar relative strength signals have preceded gains 80% of the time
This signal occurred 20 other times over the past 29 years. After the others, future returns, win rates, and risk/reward profiles were solid across all time frames, especially on a medium-term basis. The 1-month window showed benign drawdowns, with a max reading of 2.9%. However, we must remember that most signals occurred during the previous value-driven bull market between 2002 and 07. If you were wondering, the EWA ETF contains an almost 50% weighting in banks and mining.
What the research tells us...
When my RSI ratio trend model is positive and the RSI indicator crosses above 70, absolute and relative price momentum begets more momentum. Similar setups to what we're seeing now have preceded rising prices for the Australian ETF (EWA), especially on a medium-term basis. Australia is a value-driven ETF dominated by mining and banking. While it has lagged other value-dominated country ETFs, the recent shift in momentum looks compelling.