
Asia-Pacific Region Global Breadth Update

I like to monitor market breadth on a worldwide basis as various regions can provide insight into the globalization process. Most notably, the Asia-Pacific region represents one of the more critical areas for the manufacturing sector.
Let's look at a breadth composite designed to identify risk-off signals to see if the global reflation/recovery story is holding up in the critical manufacturing region around Asia.
Breadth Composite Indicator
The breadth composite contains two indicators that use long duration calculations. I prefer the long duration composite over a composite with short and long measures as it is less likely to produce whipsaw signals.
The composite includes the following:
- Percentage of Issues above the 200-Day Moving Average
- Percentage Spread Between 252-Day Highs and Lows
The individual component values are summed and divided by two to arrive at a single composite value. Please note, composite values can turn negative during corrections and bear markets as new lows overwhelm new highs in the spread calculation.
Breadth Composite Divergence Signal
The breadth composite risk-off divergence signal seeks to identify the following conditions.
- The Index price range rank is >= 90% over a user-defined lookback period
- The breadth composite range rank is <= 50% over a user-defined lookback period
- If conditions 1 & 2, start days since true count
- If days since 1 & 2 count is <= ten and the Index crosses below the price range rank threshold, and the composite breadth level is below a user-defined threshold, signal risk-off
Note: Condition 1 and 2 use the same lookback period. I optimized lookback periods and composite level thresholds across various indices.
Source: Bloomberg
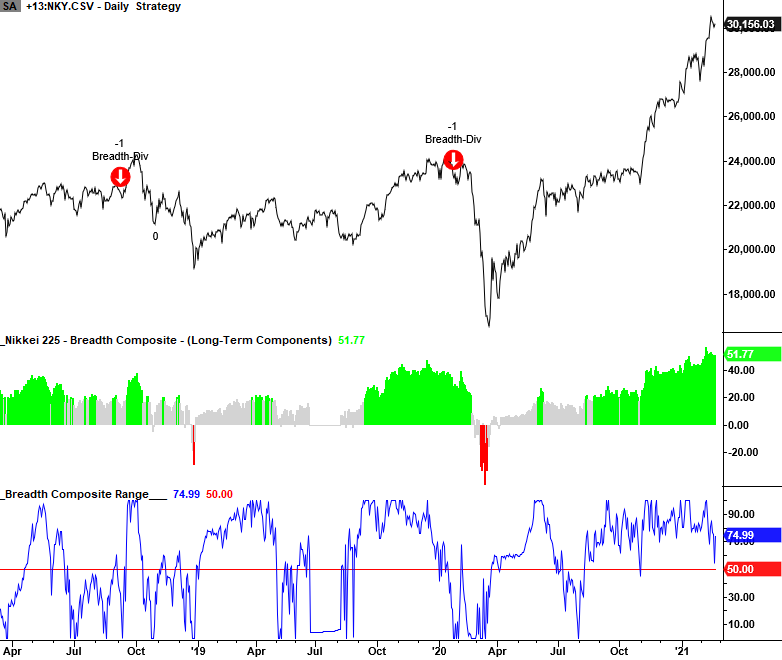
Japan - Nikkei 225 Index
While off the best levels, market participation remains very firm for the Nikkei 225.
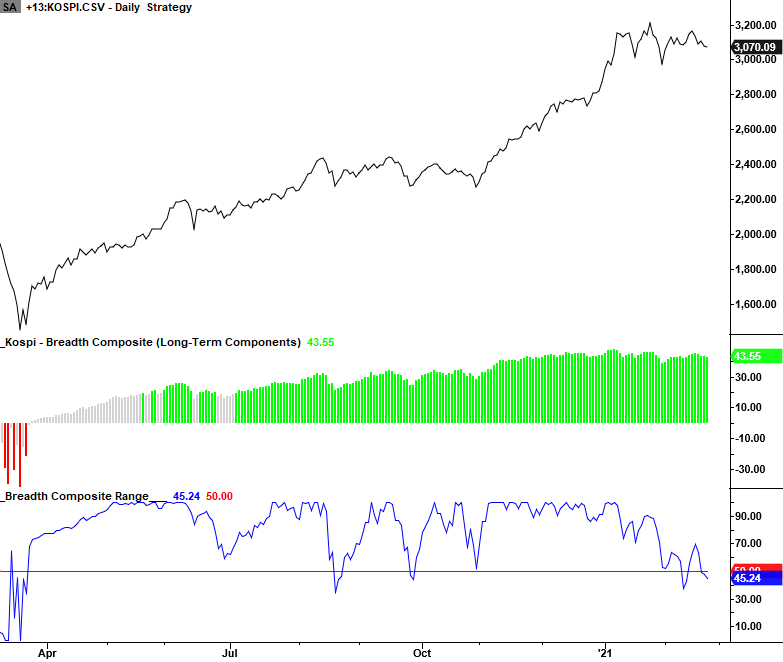
South Korea - Korea Stock Exchange KOSPI Index
While the breadth composite range rank indicator has fallen below the 50% level, the breadth composite remains well above the signal threshold level.
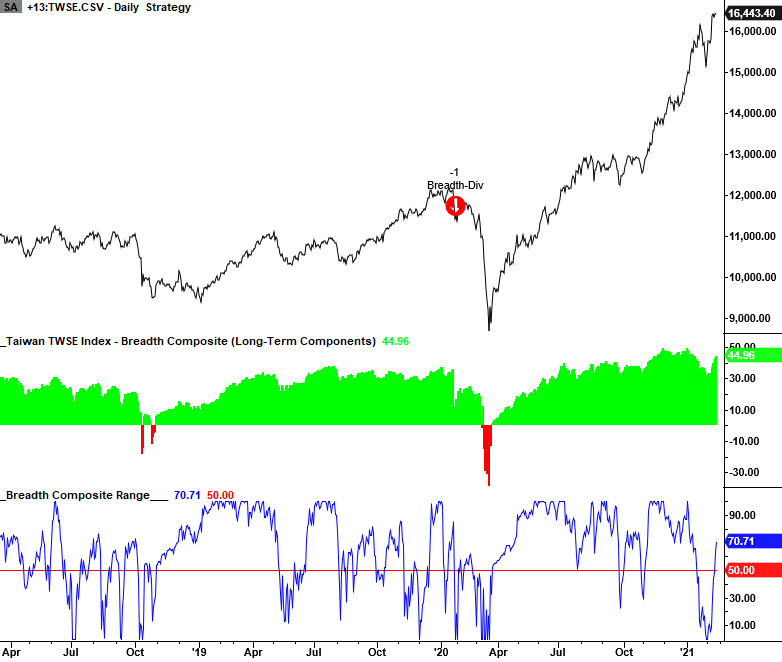
Taiwan - TWSE Index
After a quick decline in late January, the composite breadth model is now moving higher.
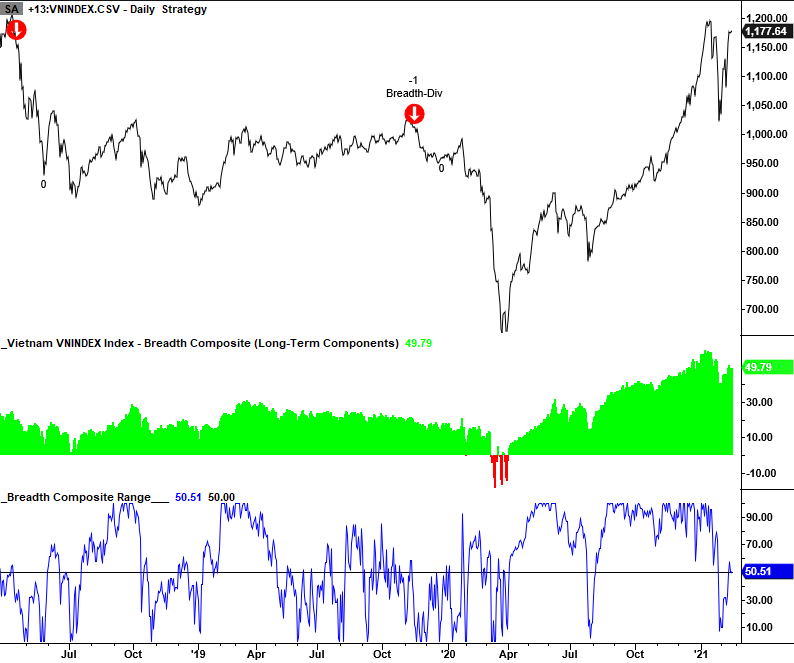
Vietnam - Ho Chi Minh Stock Index
As was the case with Taiwan in late January, Vietnam experienced a sharp and sudden drop. Breadth is now recovering.
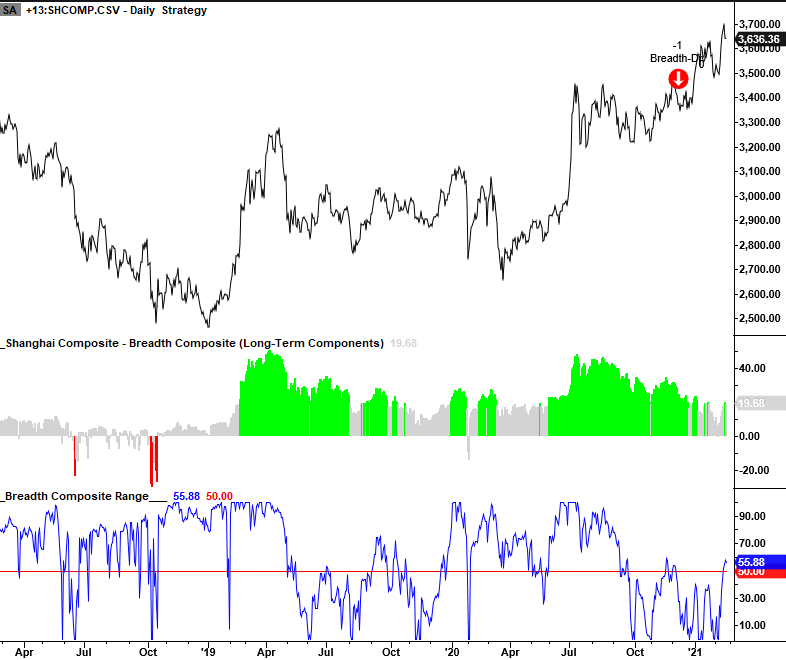
China - Shanghai Composite Index
Market breadth weakened considerably for most of the second half of last year for the Shanghai Composite. I'm not surprised, as that is what typically happens in a consolidation. Participation has been underwhelming as the Index recently registered two new higher highs.
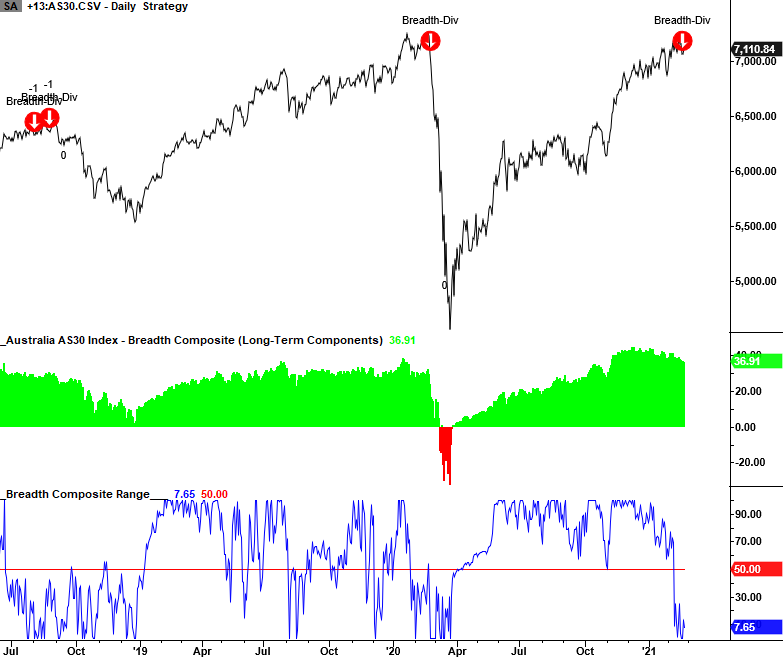
Australia - AS30 All Ordinaries Index
While not a manufacturing powerhouse, I keep a close eye on Australia as it is a resource-rich country that exports several important ones to China. The breadth divergence model registered a risk-off signal on 2/19/21.
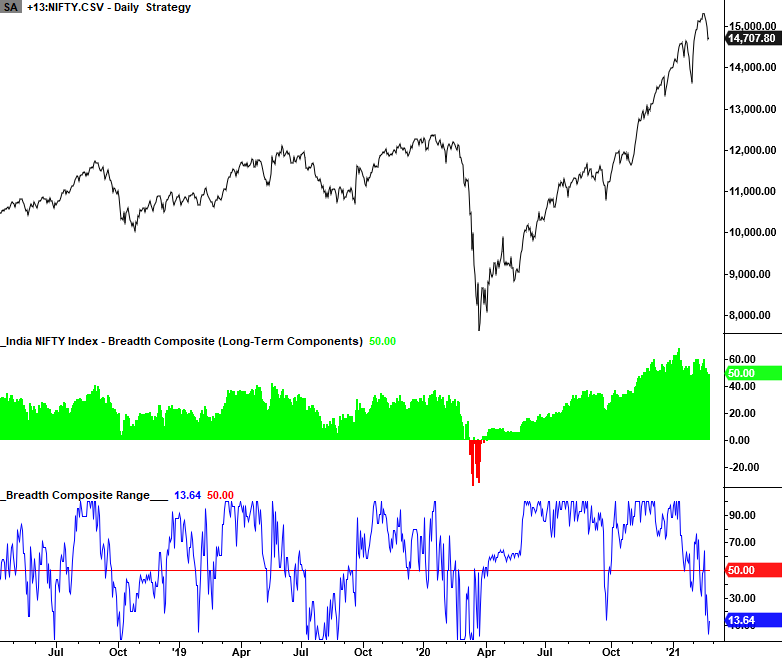
India - NIFTY 50 Index
Market participation has deteriorated of late and made a lower high as the Index made a higher high. However, the model failed to initiate a signal as the composite remained above the threshold level for an alert.
Conclusion: Market participation remains firm across several country indices across the Asia-Pacific region. When divergences occur, I like to see them across several countries simultaneously. The global reflation/recovery story remains constructive.