
As Nikkei Rallies Hard, Its Momentum Stays Calm

Key Points:
- Japan's Nikkei 225 is in a notably robust rally, hitting new highs frequently
- Vs historical top patterns, its current internal breadth is relatively healthy
- More notably, its internal momentum is unusually calm-rare in history
- When these traits combine, they often signal medium-to-long-term upside, not short-term peaks
High Momentum is the Foundation, but Requires Cautious Interpretation
The Nikkei 225 Index is undoubtedly one of the focuses of the global market this year. The index's continuous breakthroughs mark the advent of a new phase, while also prompting investors to examine the classic question of "whether the rally can be sustained."
Typically, when an index surges and hits new highs repeatedly at such a pace, analysts begin to examine its internal structure for "non-confirmation" signals-the most common of which is when the number of rising stocks fails to keep pace with the index, known as "negative divergence."
This phenomenon is sometimes seen as a warning sign of potential trend exhaustion.
However, interestingly, the picture we are currently observing seems to present a different scenario.
First, we identified all historical "high momentum" periods similar to the current one. The table below shows past instances where the Nikkei Index recorded at least 9 days of 52-week highs within 21 trading days. This represents a strong upward force in the market.
From a historical data perspective, the original momentum signal tends to perform positively over the long term. However, it also contains a great deal of noise.
For example, the signal in March 2024 appeared near a phased top, followed by a market correction. This may indicate that relying solely on momentum for judgment is not sufficiently reliable.
Breadth Confirmation Seems to Enhance Signal Consistency
Next, we added a second filter: only retaining periods with healthy upward NKY Breadth (% > 200 Day Avg) (i.e., the divergence degree of component stocks is below 6%). We refer to this as a "breadth-confirmed trend."
The results showed a significant change: the win rate (% Positive) improved markedly across multiple time horizons, reaching a high of 90% after 3 months.
Notably, the earlier March 2024 signal- which appeared near a top-was filtered out in this step. This suggests, to some extent, that a rally supported by the majority of stocks may deliver more stable subsequent performance.
Calm Internal Momentum Creates an Even Rarer Scenario
What is even more unusual is that amid the current strong and healthy rally, the market's internal momentum-measured by the NKY McClellan Oscillator (McOsc)-has remained unusually calm, never exceeding the +50 level.
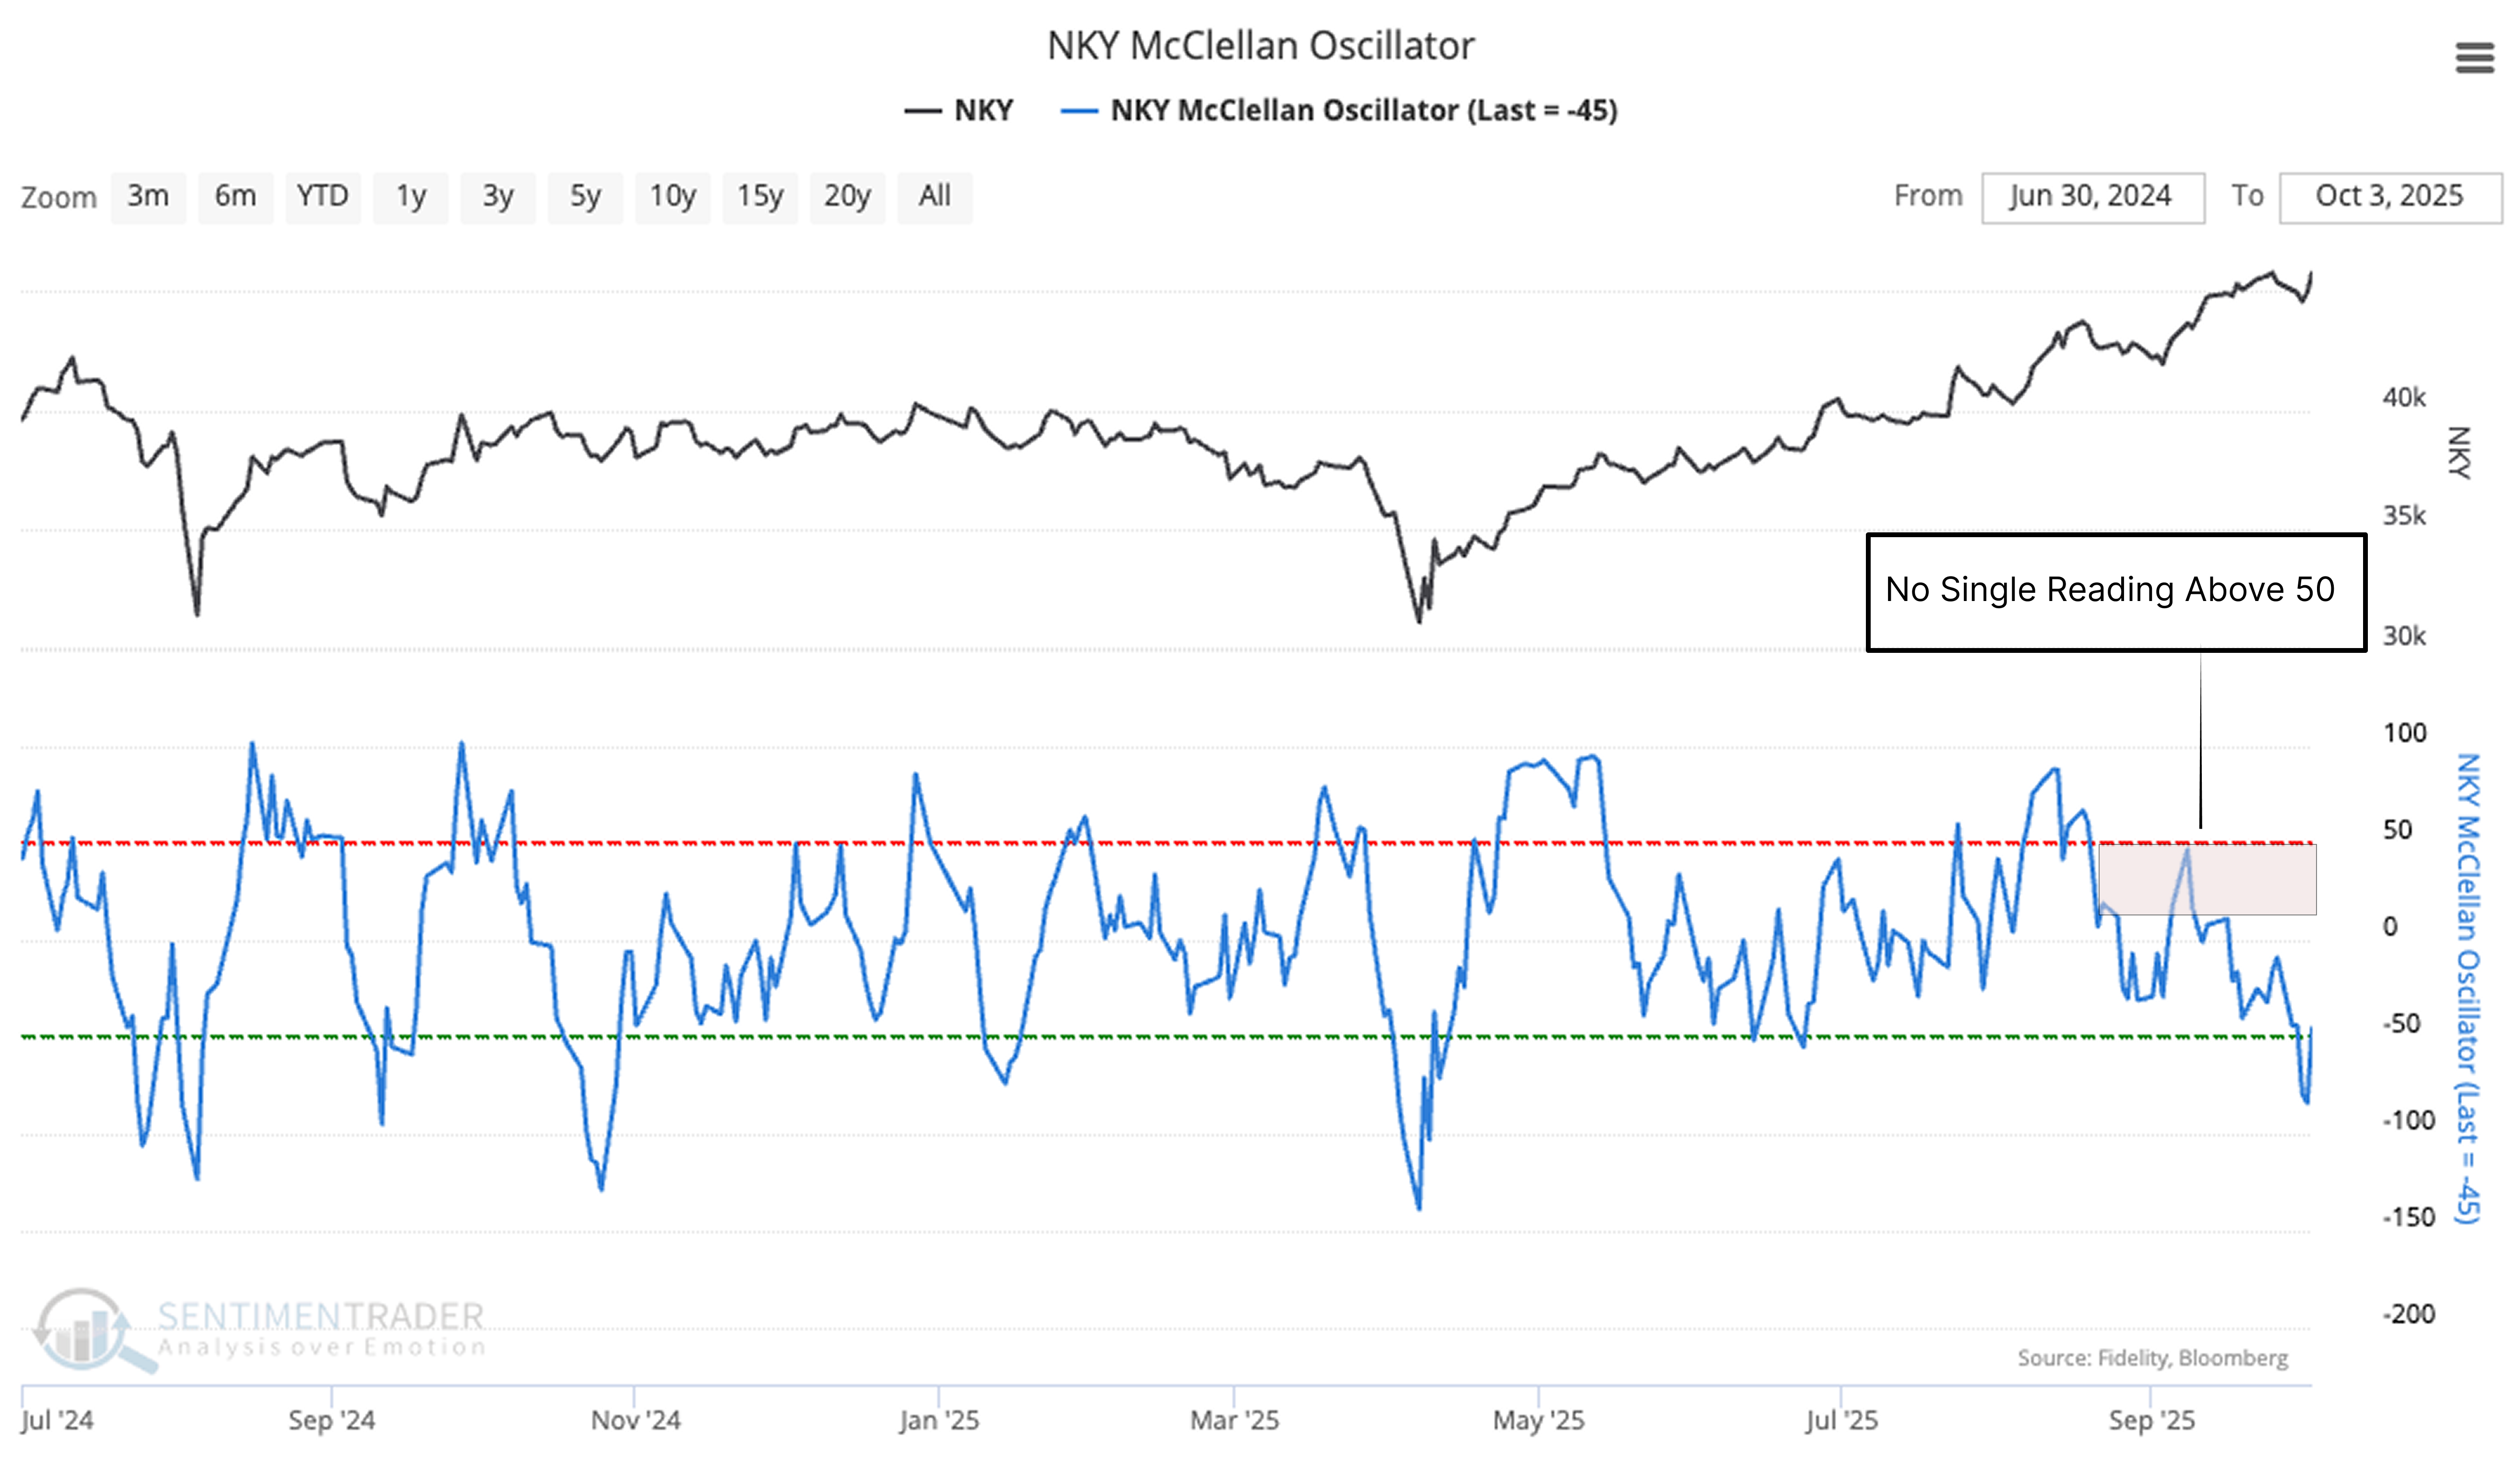
Historically, it has been quite rare to meet the three conditions of "strength," "health," and "calmness" simultaneously.
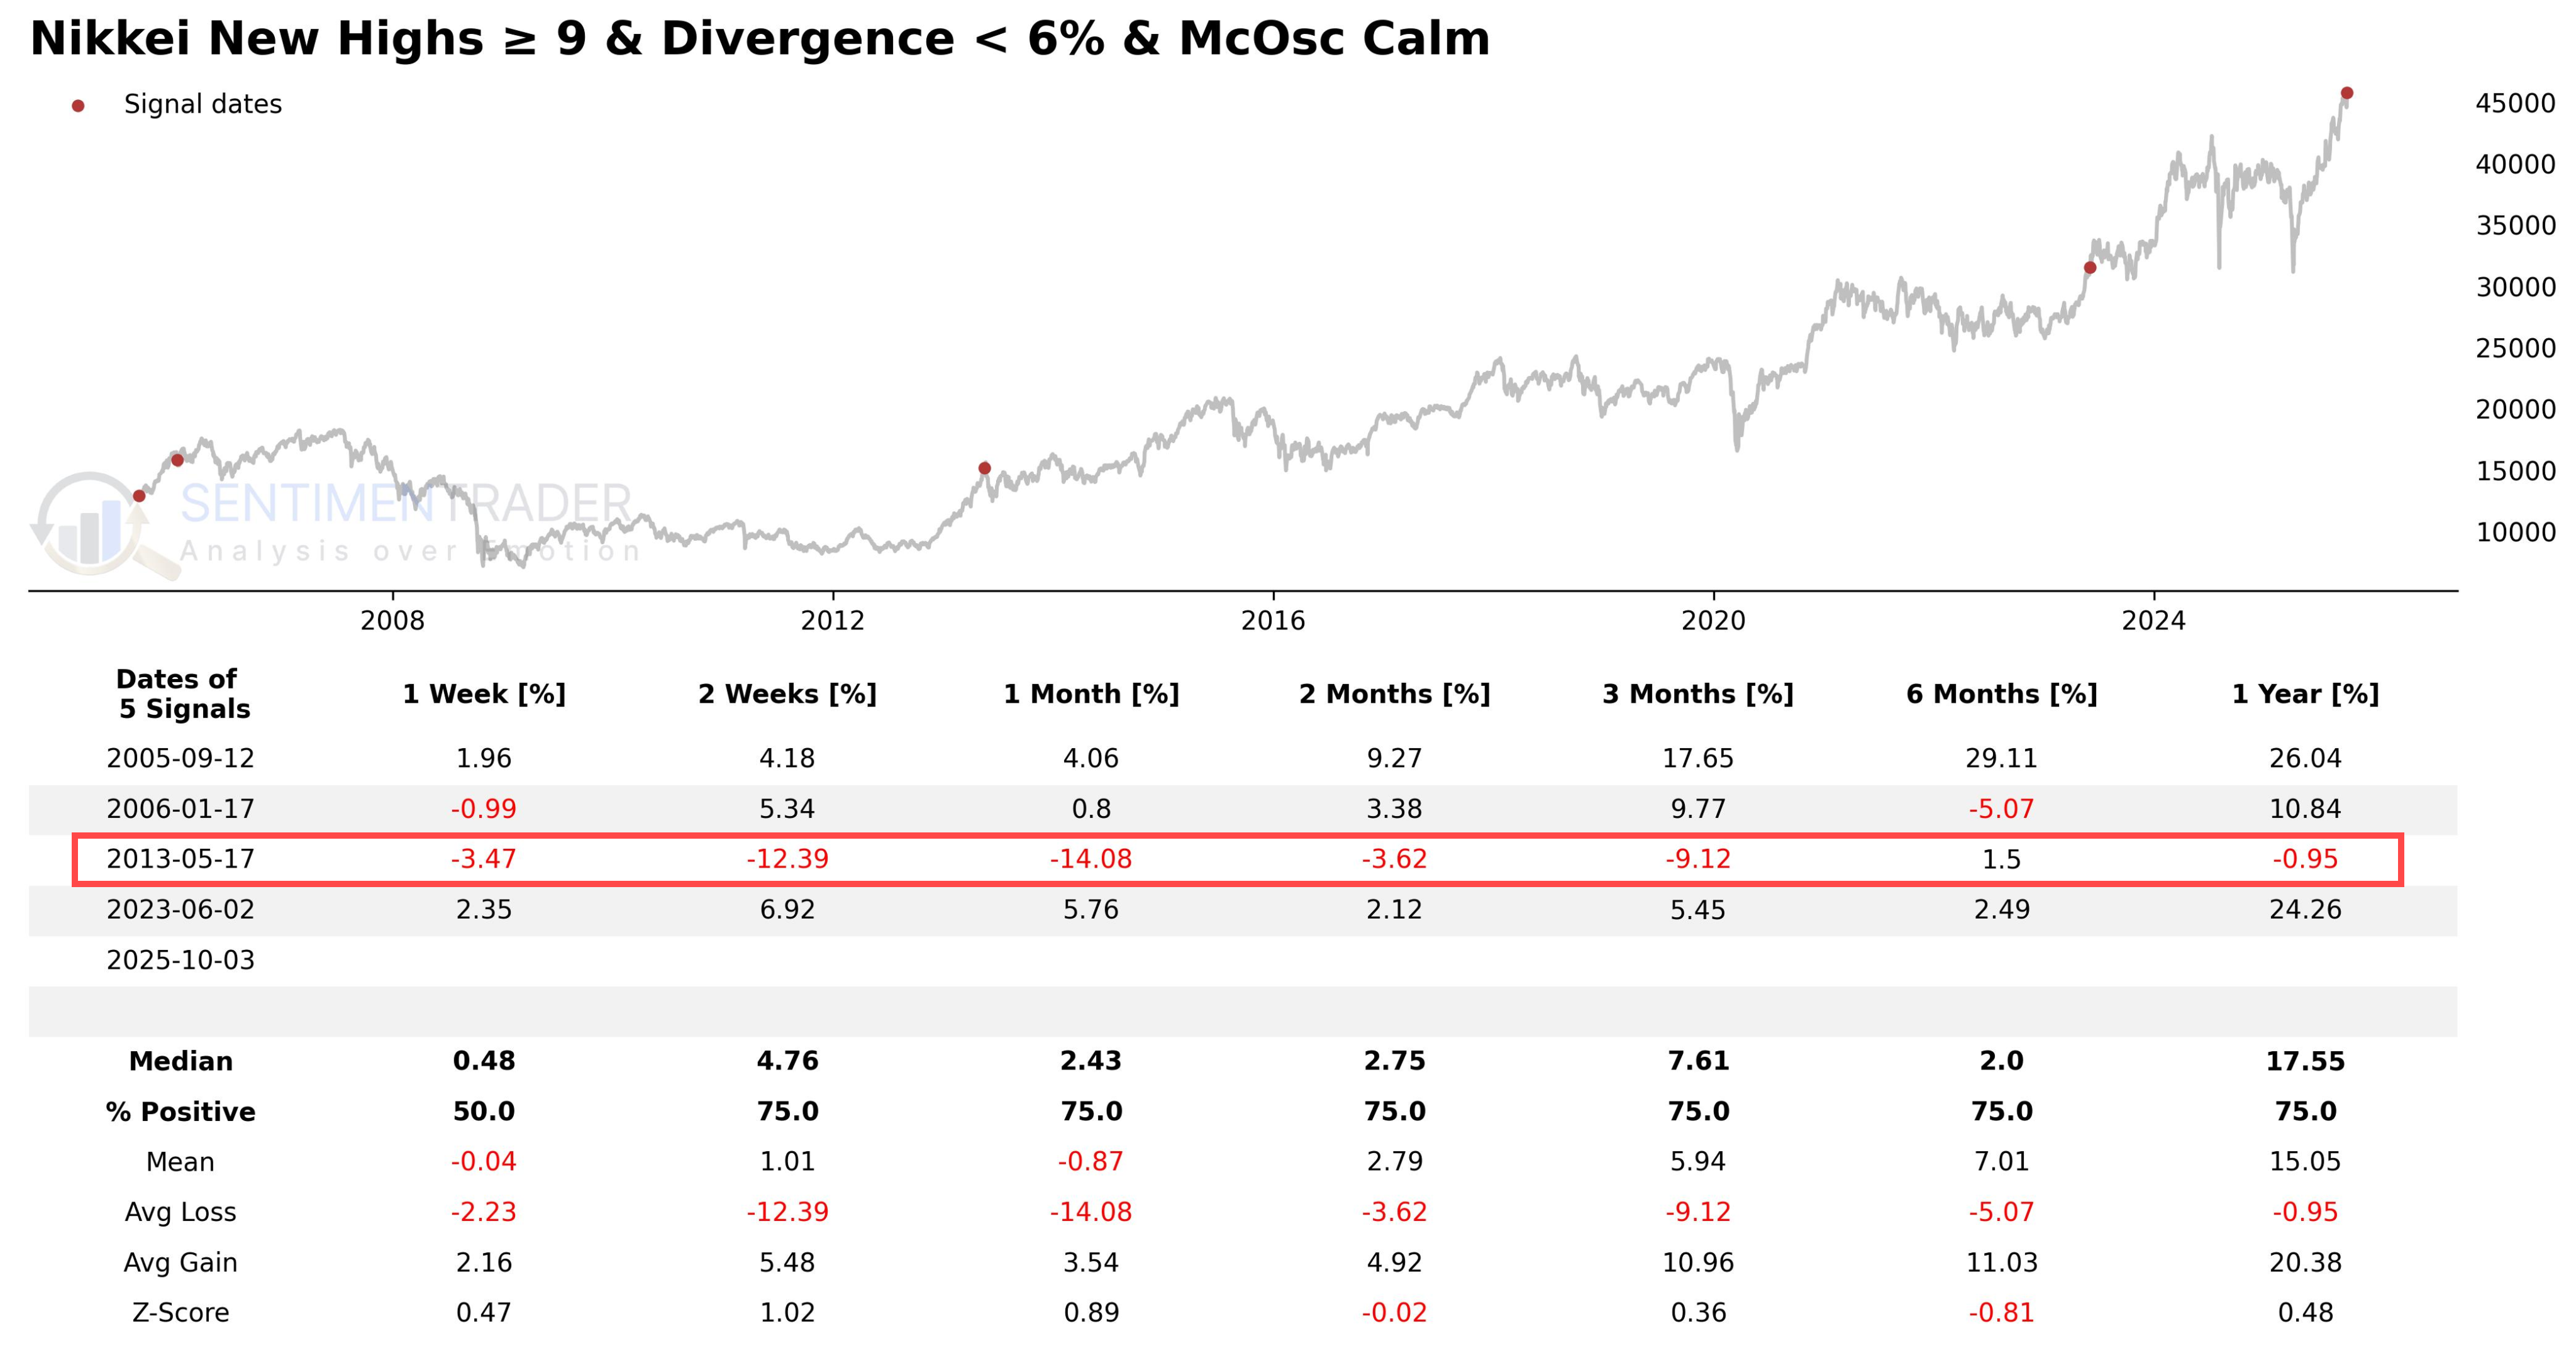
We only found 4 historical precedents similar to the current situation. First and foremost, it must be emphasized that such a small sample size makes it difficult for us to draw definitive conclusions with statistical significance.
Interestingly, even this seemingly "ideal" setup does not fully avoid the risk of short-term corrections-for instance, a sharp decline occurred after the 2013 signal.
Nevertheless, from a longer-term perspective, the results tend to be optimistic. The median return one year after the signal appeared reached +17.55%.
This seems to indicate that while this rare market state cannot be immune to short-term fluctuations, it may provide a relatively favorable backdrop for medium- to long-term investors.
What Does the Research Tell Us...
When a major index like the Nikkei surges, investors usually carefully look for potential risk signals, such as negative divergence.
However, our current research seems to reveal a noteworthy and different scenario: a strong upward trend confirmed by broad participation, and this trend may have been built amid calm (rather than frenzied) market sentiment.
Historically, this has rarely constituted a typical topping signal. Although the sample size is limited and history does not simply repeat itself, the available evidence seems to suggest that the foundation of the current trend may be more solid than it appears on the surface. This does not rule out the possibility of a normal market correction, but it at least provides a data-driven perspective: before clear signs of internal deterioration emerge, choosing to exit solely due to the magnitude of the rally may require second thought.