
Are semiconductors flashing a warning that the AI-driven rally is over?

Key points:
- Multiple price trend indicators activated technical warnings for the semiconductor group
- Similar trend conditions suggest the semiconductor group could struggle over the next six months
- Technology and other cyclical sectors underperformed, whereas defensive groups outperformed
More evidence suggests that a former tech darling has ceded its leadership status
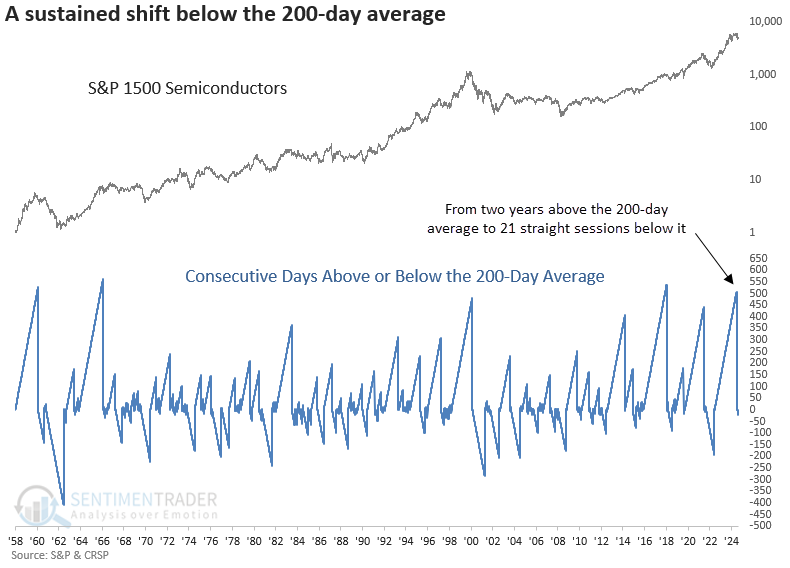
After closing above its 200-day average for two years, the 4th longest stretch in history, the S&P 1500 Semiconductor group, a key beneficiary of the AI boom, closed below its long-term average for 21 straight sessions.
When enthusiasm for stocks in an innovation cycle becomes entrenched for years, and the trend decisively turns, investors should prioritize risk management over hope for another extended rally. Remember, it's never different this time, and hope is not an investment strategy.
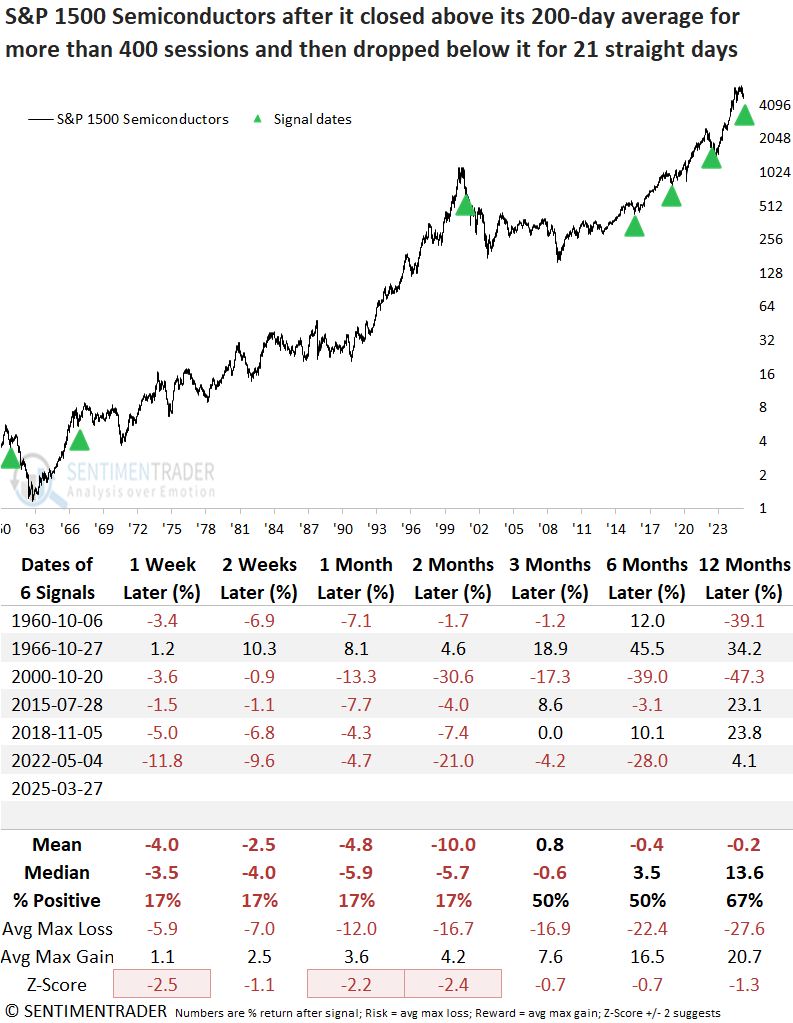
The prior signal emerged in May 2022, after which the semiconductor index tumbled 21% over the next two months.
Historical perspective
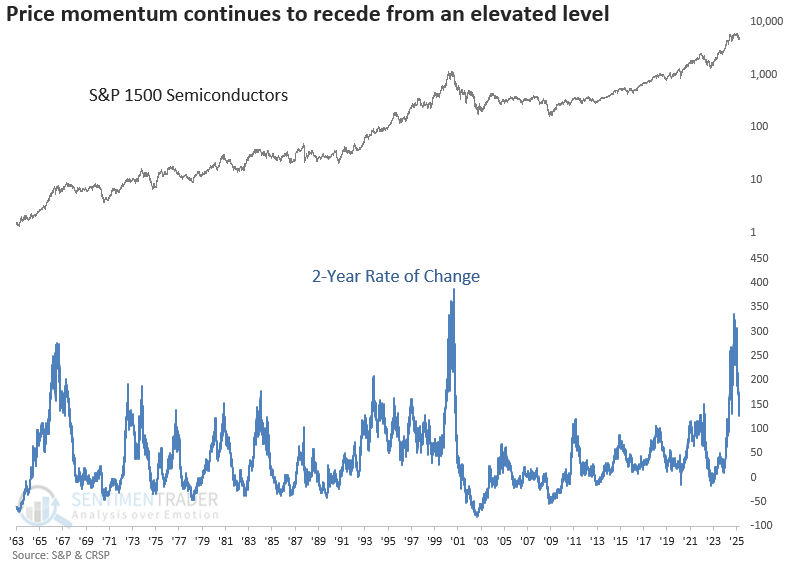
The S&P 1500 Semiconductor group soared by 336% over two years ending in October 2024, marking the second most significant change in history, surpassed only by the Dotcom era. Remember, price corrects either through time, sharp declines in magnitude, or a combination of both.
Comparable drops below the 200-day average preceded a negative outlook
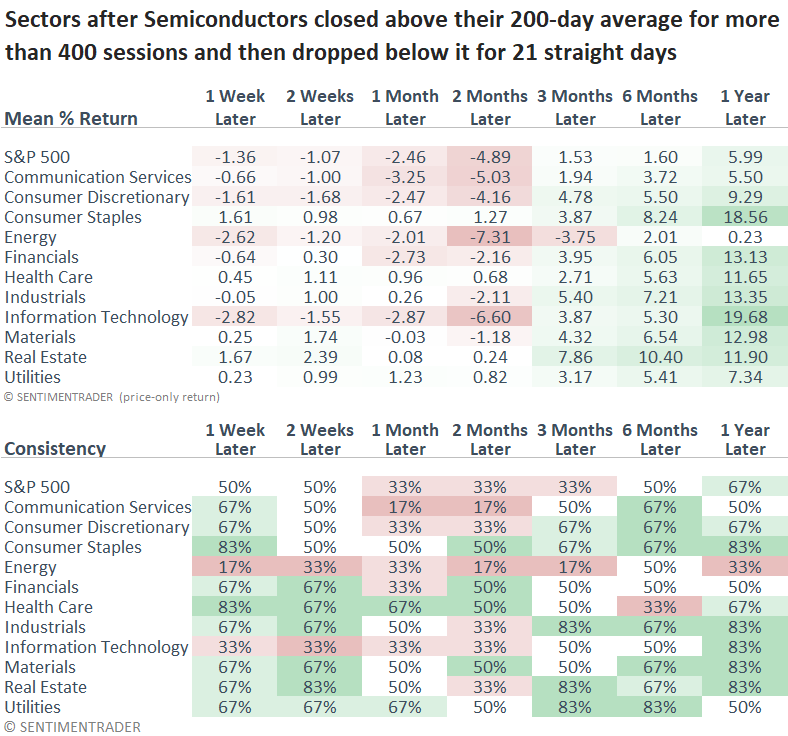
Although the sample size is small, whenever the S&P 1500 Semiconductor industry closed below its 200-day average for 21 straight days following an extended period above it, the bellweather technology group displayed unfavorable returns and consistency across all time frames.
Even in 1966, the sole instance where the group advanced over the next year, it was down three years later.
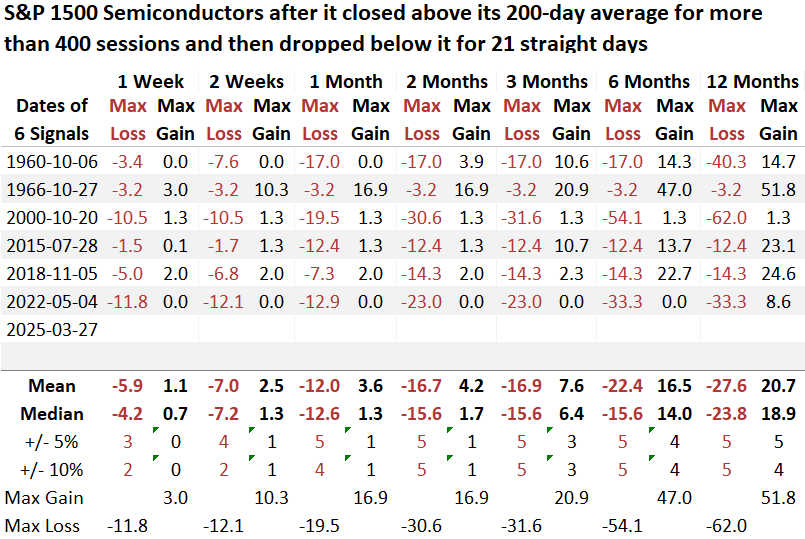
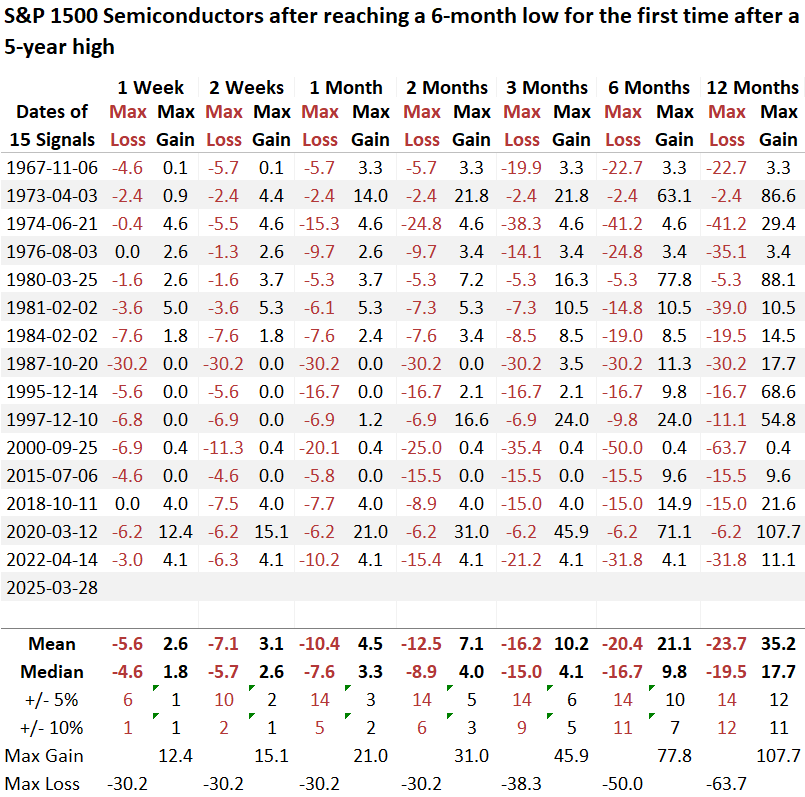
Across all time horizons, the average and median max loss was more significant than the maximum gain, signaling a poor risk/reward profile.
As expected, technology and other cyclical sectors showed weakness in the initial months as defensive groups outperformed the broader market. However, a year later, technology rebounded, surpassing all sectors, an often-seen scenario following corrections or bear markets.
Additional evidence suggesting a trend change
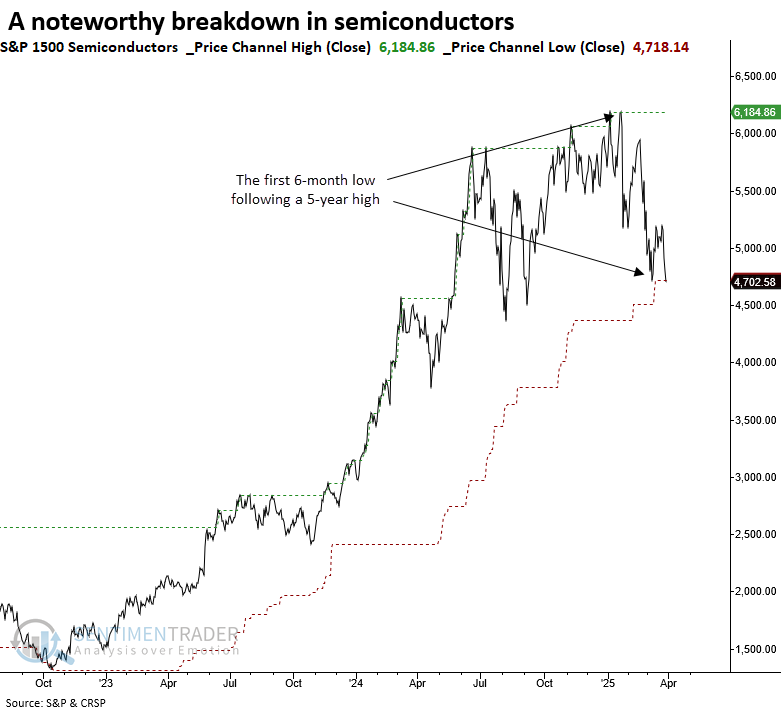
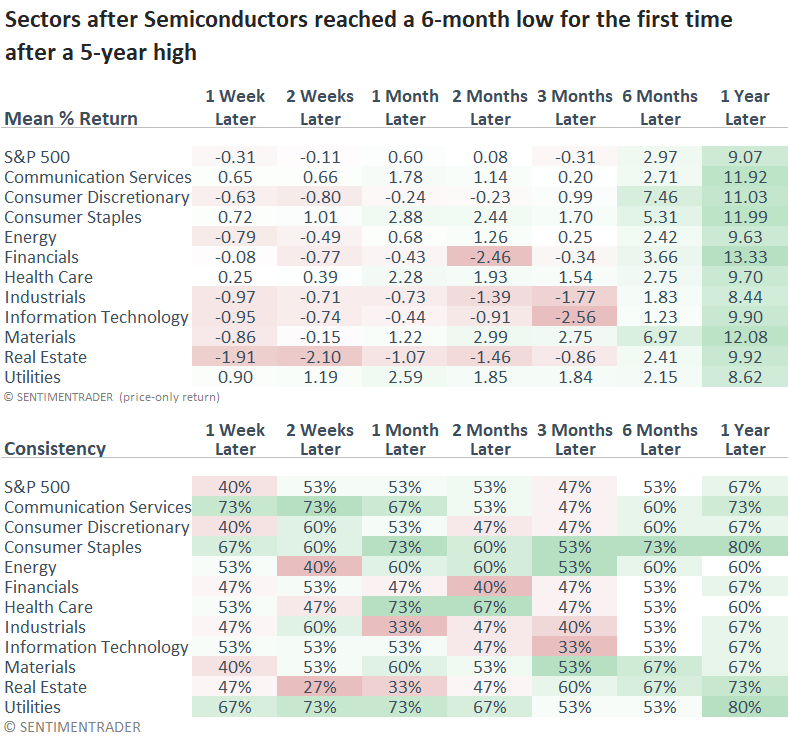
The S&P 1500 Semiconductor group's sharp move from a 5-year high to a 6-month low strengthens the case for a significant trend change.
Similar price breakdowns led to consistent declines in the semiconductor group over the following six months, with significant risk in the initial weeks, during which it dropped 73% of the time.
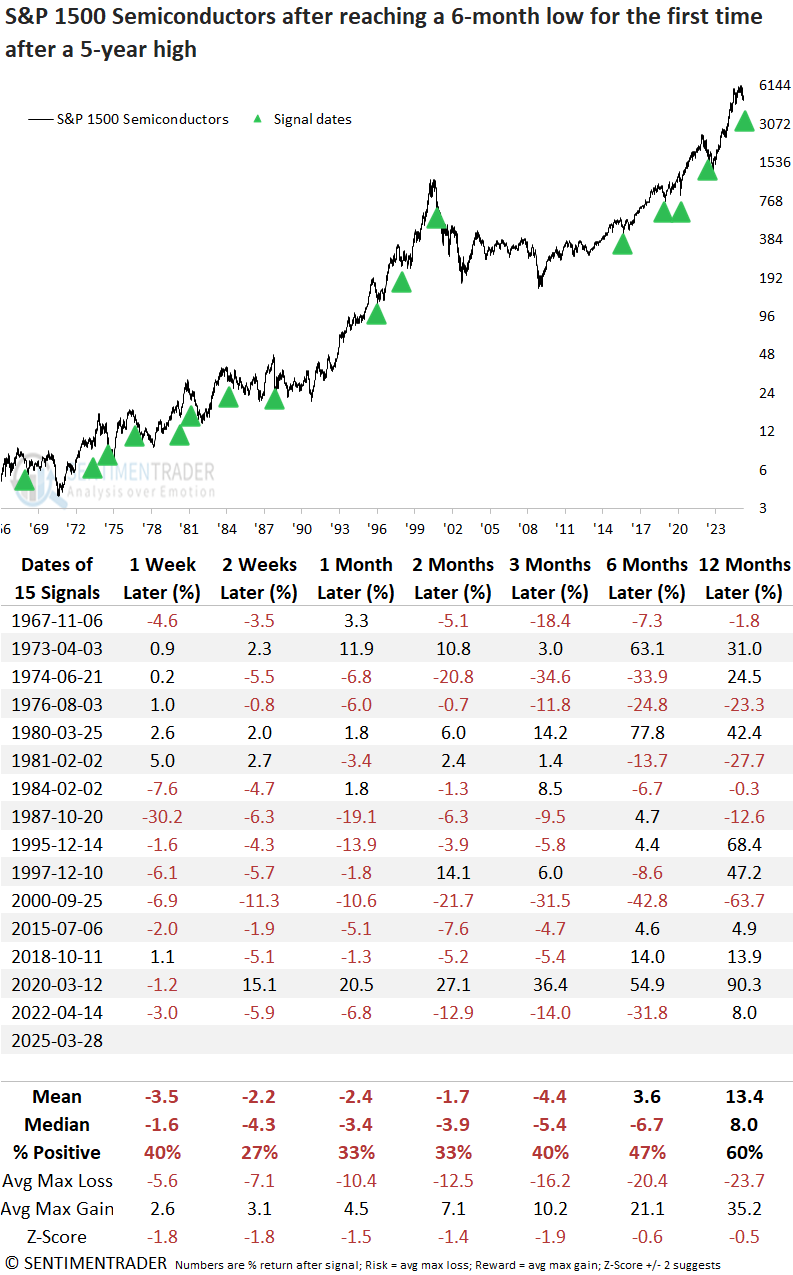
Despite a 23% drop from its peak, the semiconductor industry faces a high risk of further downside, as indicated by the max gain and loss outlook table. Over the next six months, the index fell by 10% or more in 11 of 14 instances.
In line with the 200-day average analysis, cyclical sectors such as technology weakened, while defensive sectors, especially staples, posted favorable returns and consistency.
What the research tells us...
The S&P 1500 Semiconductor sub-industry, a bellwether technology group at the forefront of the AI frenzy, triggered several price trend warnings, suggesting that the long-term trend for this group could be transitioning from a bullish to a bearish status. Comparable trend conditions resulted in unfavorable returns and consistency over the next six months, with many of these precedents aligning with significant corrections or bear markets. Consequently, investors should keep an open mind regarding the possibility that the 10% correction in the S&P 500 could evolve into something more severe. Under this scenario, a high-risk group like semiconductors could see substantially more downside than the world's most benchmarked index.
Given their oversold status relative to other groups, should the broad market find a bottom and experience another relief rally, technology and semiconductors could lead the rebound. However, if they lag, it could be another critical clue regarding their trend shift.