
Are Converging Signals Pointing to a "Pre-Storm" Phase?

Key Points:
The CDX risk signal appears bullish but is a trap.
Filtering for current market conditions (low VIX, weak PMI) reveals high mid-term correction risk.
Rate-cut hopes are battling economic reality.
This is a major risk warning; prioritize risk management over buying.
Credit Market Sounds the Alarm
One of the cornerstones of a healthy stock market environment is stability in the credit market. Bond traders are often regarded as the "smarter money," and their pricing of corporate default risk typically acts as a leading indicator for the stock market. The core indicator we monitor is the Credit Default Swap Index (CDX), which is essentially the "VIX of the corporate bond market." When traders grow concerned about the future, they purchase credit protection, thereby pushing up the CDX index.
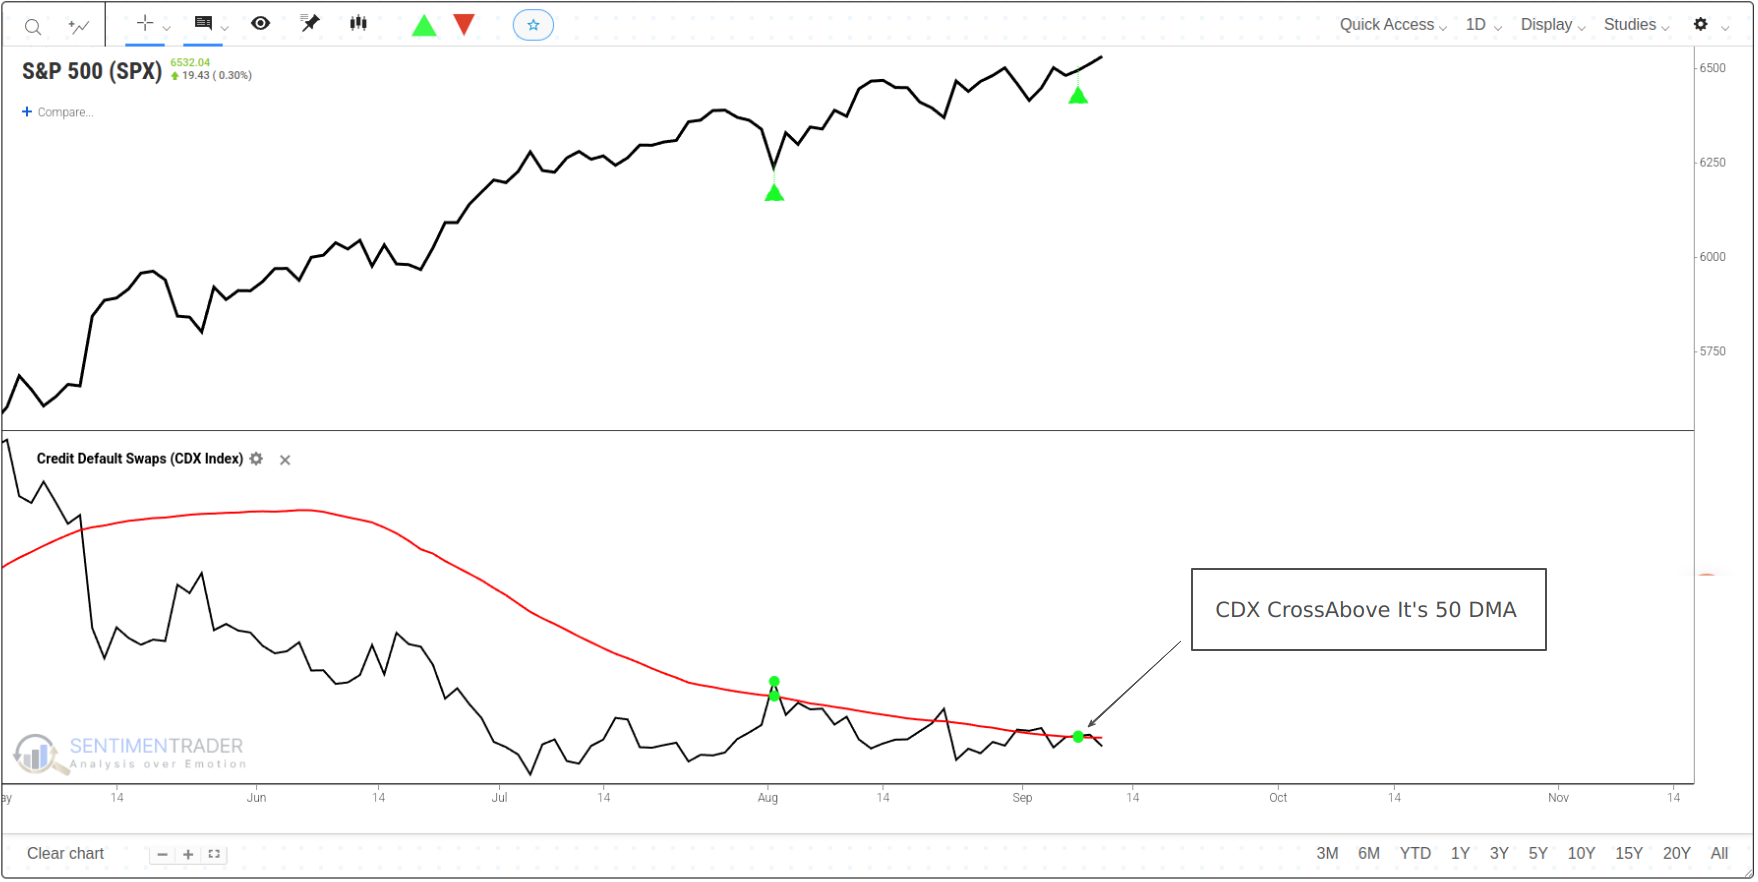
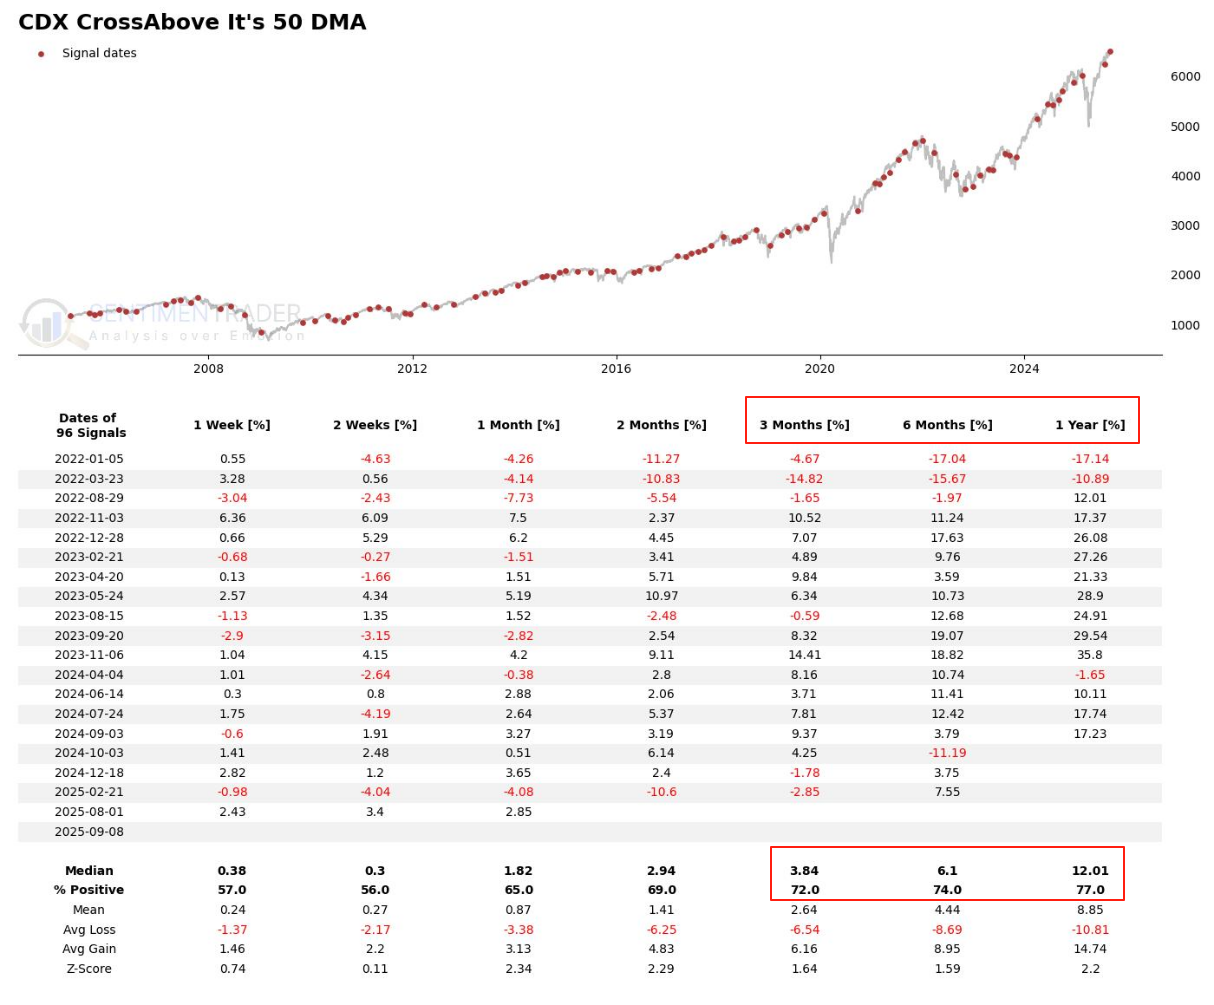
Recently, a notable phenomenon has emerged: the CDX index has been fluctuating around its 50-day moving average, indicating unusually intense bull-bear battles within the credit market. Since July 31, this marks the third time the index has broken above this critical moving average. In the 3 months, 6 months, and 1 year following the signal trigger, the S&P 500 Index had an upside probability of 72%, 74%, and 77% respectively.
More notably, its median returns steadily increased to 3.8%, 6.1%, and 12.01%. Significantly positive Z-scores across multiple timeframes (e.g., around 2.3 for the 1-month and 2-month periods) also indicate that this positive bias is not random.Related Backtest Click Here.
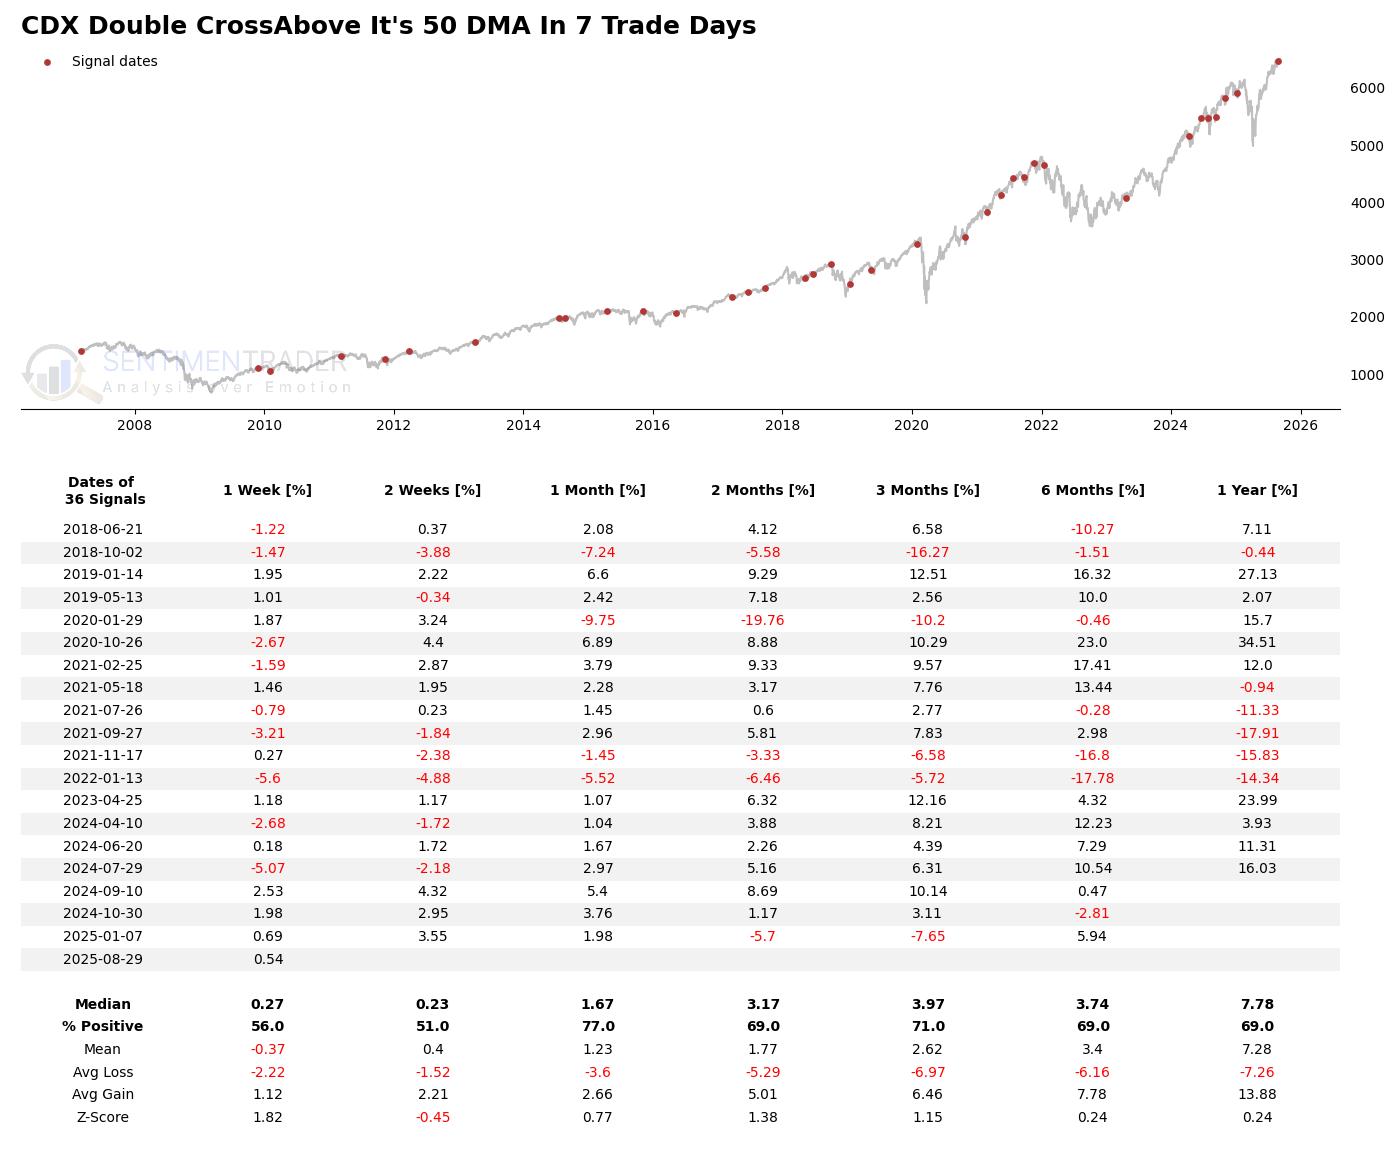
To more precisely quantify this "struggling" behavior, we examined instances where the CDX index crossed above its 50-day moving average twice within a short 7-day period. The results of this "double cross" signal reveal a noteworthy psychological pattern.
Initially, the market shows surprising resilience, with a 77% probability of a gain one month later, suggesting investors may become numb to the repeated warnings. However, this short-term strength has often been a precursor to significant trouble.
This specific pattern of instability has historically preceded some of the most significant medium-term drawdowns, including the Q4 2018 decline, the pre-COVID crash in 2020, and the onset of the 2022 bear market.
This suggests that a "double cross" is not a sign of the market successfully fighting off risk, but rather a confirmation that a persistent underlying problem is not going away, often leading to an eventual, more severe price correction. Related Backtest Click Here.
How to Create a Backtest for a Double Golden Cross Signal
For the two signals of breaking through the moving average in the article, you can follow these steps to create them:
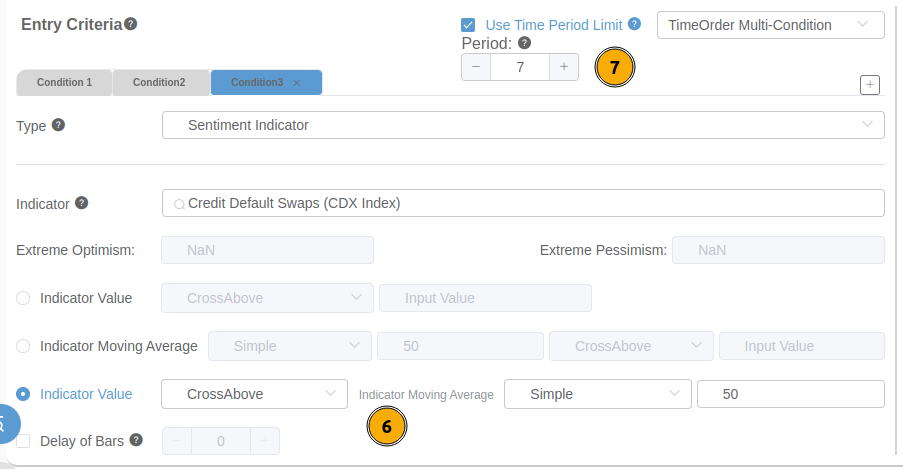
1. Select Sentiment Indicator, then choose Credit Default Swaps (CDX Index)
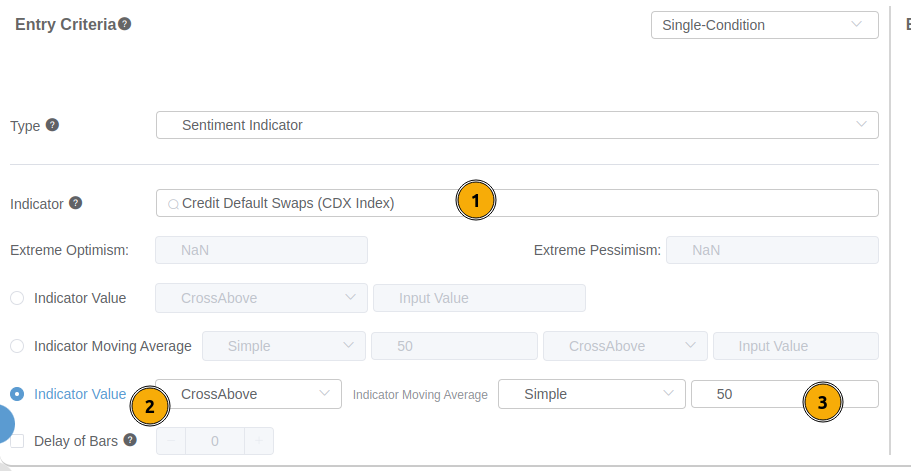
2. Select Time Order, add Signal 2 and Signal 3-CrossBelow followed by CrossAbove-and set the maximum period for all signals to be satisfied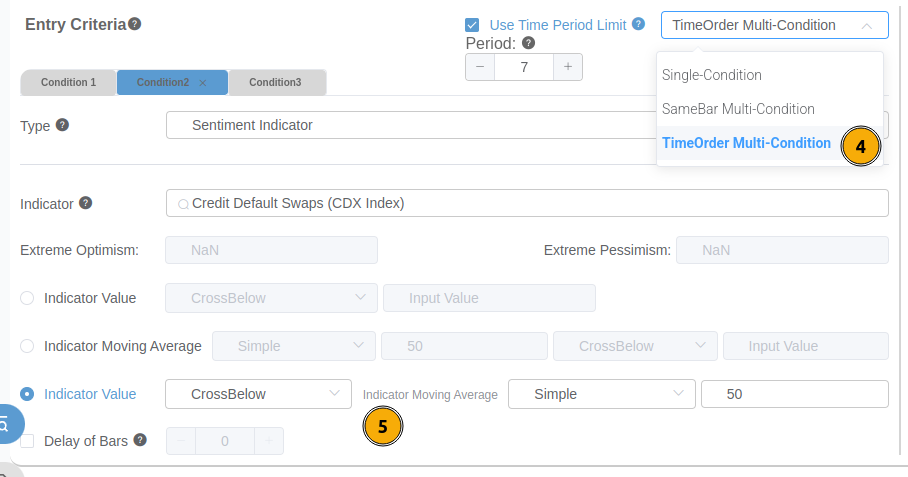
The "Metamorphosis" of the Signal Under Layered Filters
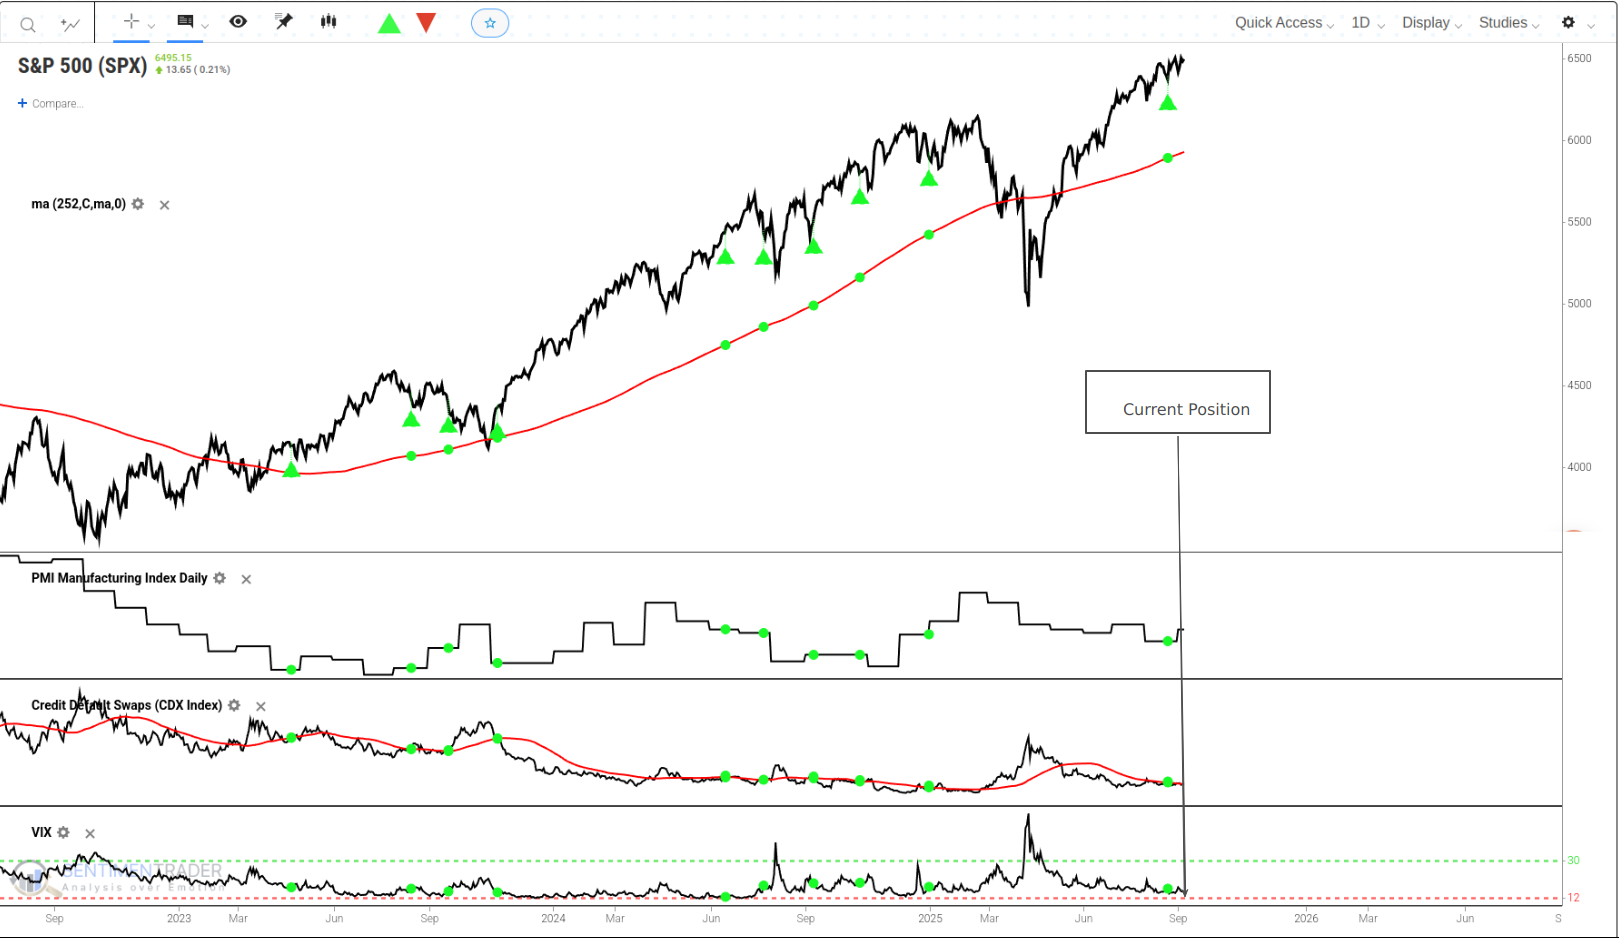
To truly understand the meaning of this recurring alarm, we must examine it within the context of the current unique market environment. The current VIX stands at 15.11, a historically low level, creating a stark "sentiment divergence" with the heightened tension reflected in the CDX. Second, the current PMI is 48.7, placing it in contraction territory.
With the PMI hovering around the 50 expansion-contraction threshold, it also reflects that the economy is at a "moderate contraction" crossroads, increasing market uncertainty. Finally, regarding the market's long-term trend (S&P 500 vs. 252-day moving average), the S&P 500 currently remains above its annual moving average.
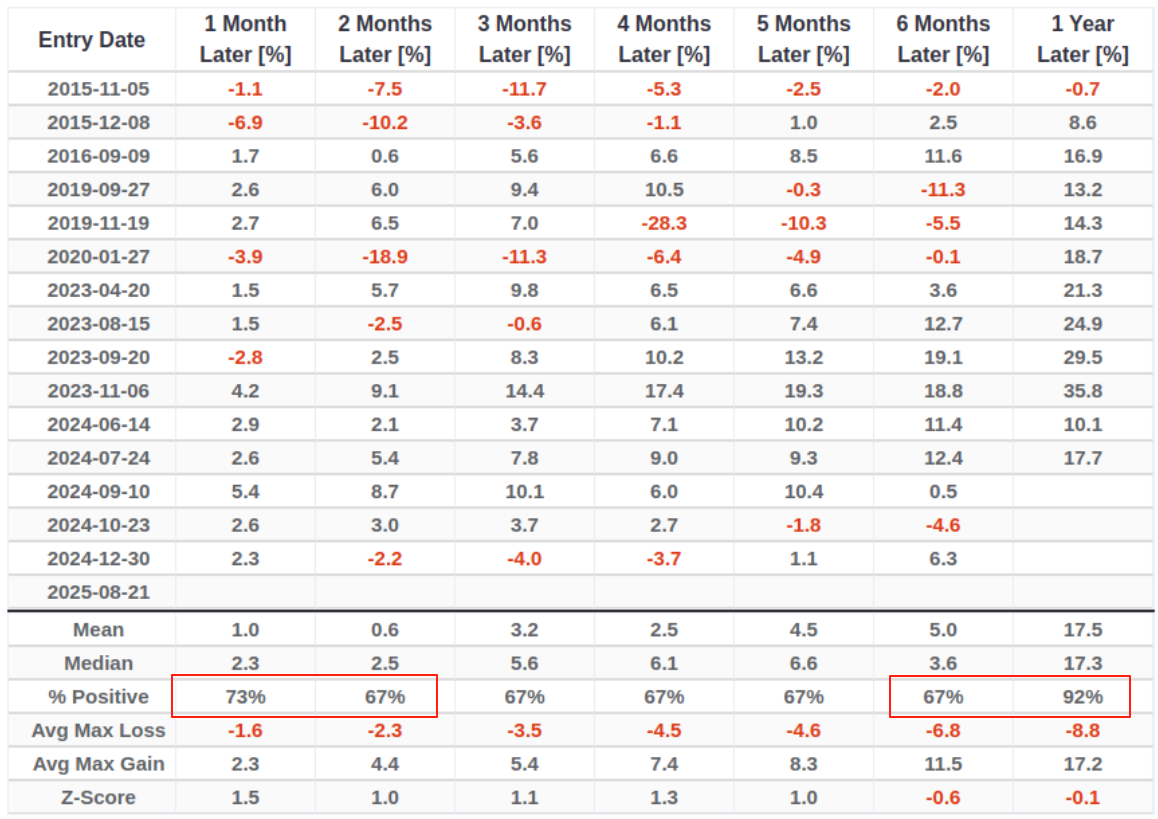
Under current filtered conditions (VIX < 20, PMI < 50, SPX > 252d MA), historical data reveals a deceptive pattern. The market initially appears strong (73% 1-month upside probability) but becomes highly vulnerable to sharp, double-digit pullbacks in the mid-term (2-6 months), before showing a strong recovery (92% 1-year upside probability).
Although based on a limited sample size, this highlights a fragile market where weak fundamentals could override positive expectations, increasing the risk of a significant mid-term correction.Related Backtest Click Here.
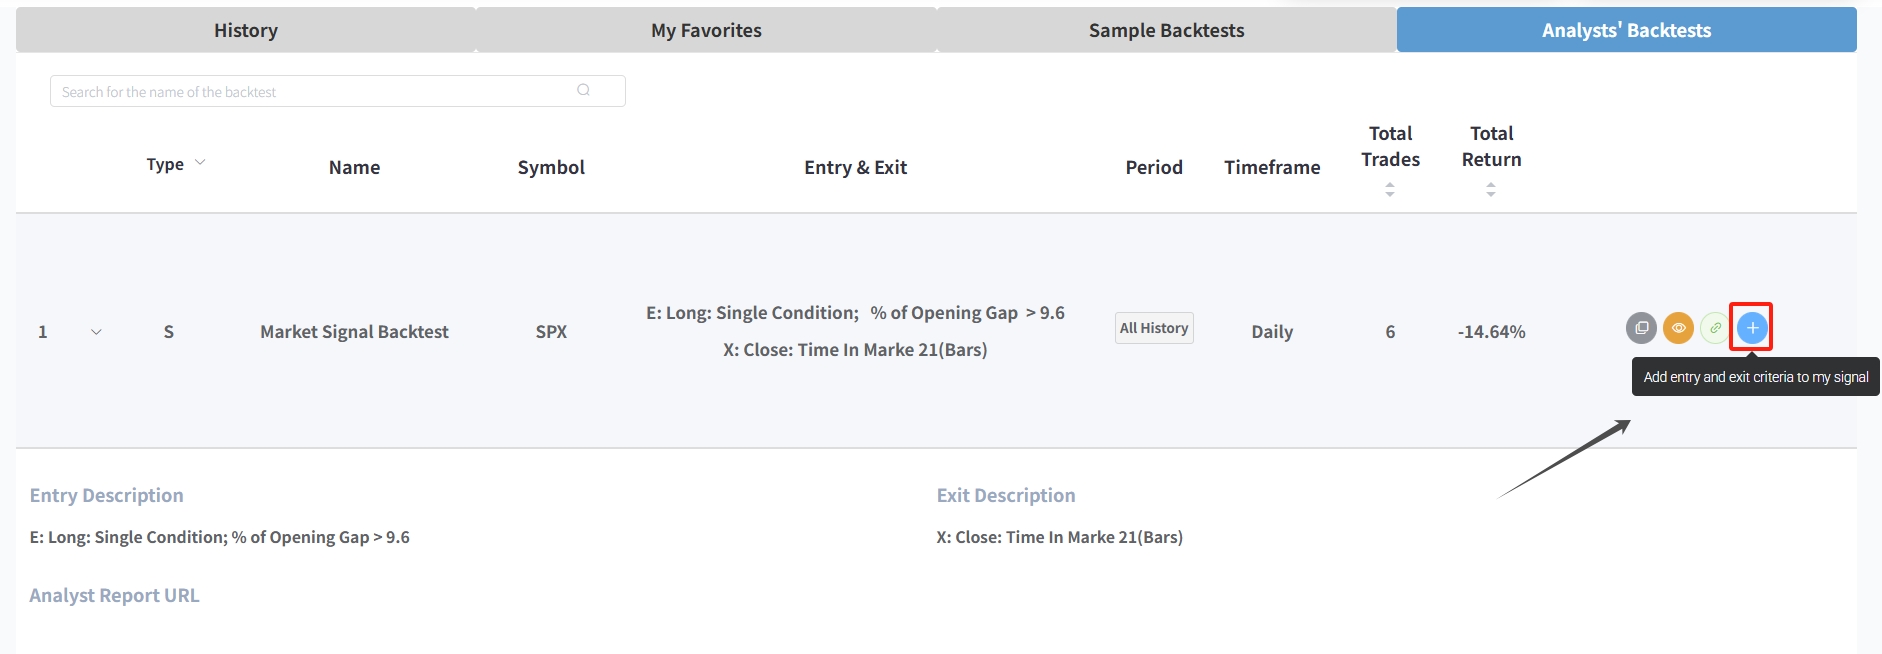
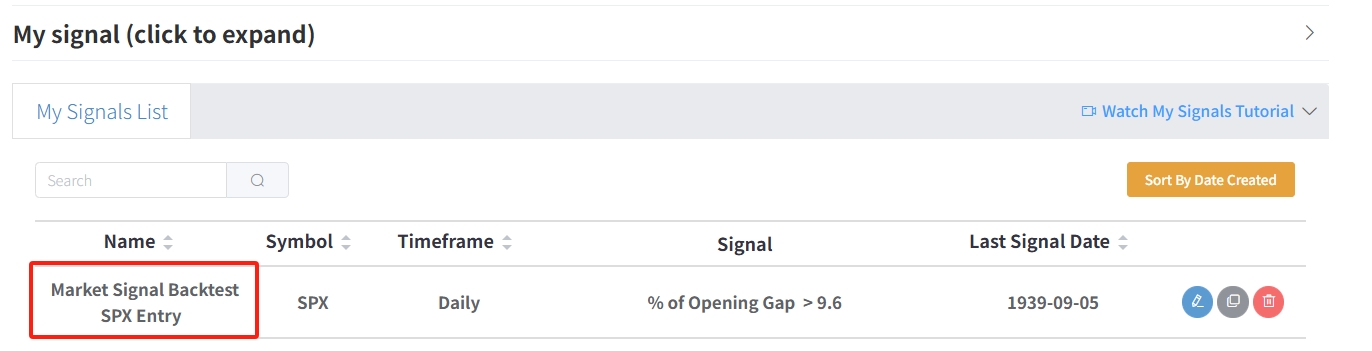
Never miss a crucial signal again. The Analysts' Backtests interface now features a "+ Add to My Signals" button that lets you instantly import entry and exit criteria from any analyst's backtest (e.g., a Trend Tracking Backtest, Market Signal Backtest, or other strategy) into your personal My Signals List.
What the Research Tell Us...
Data indicates that the current market is in a fragile balance torn between two powerful forces: on one hand, strong expectations of Fed interest rate cuts-an invisible hand supporting stock indices, suppressing VIX, and bringing short-term resilience to the market; on the other hand, the reality of trade policy harming the real economy-eroding corporate fundamentals and sounding the alarm through the credit market (CDX).
Historical data does not necessarily predict the future, but it provides a valuable risk assessment framework. When all conditions converge, historical patterns suggest that this contradiction between expectations and reality will likely be resolved through a significant market correction in the coming months. Therefore, the true value of today's signal lies not in predicting exact market levels, but in clearly revealing the significant deterioration of the current market's risk-reward ratio. At this juncture, preserving capital is far more important than chasing uncertain gains. The real opportunity may only emerge after the storm passes.