
April was Terrific (and why it matters)

Key Points:
- There has been a lot of talk lately about a positive outlook for stocks for the remainder of 2026, based on a strong performance in April
- For the record, I first wrote about this tendency five years ago (see here); The text below revisits and slightly expands that original study
- The bottom line is that if history proves an accurate guide (and that is never guaranteed), the sharp advance during April suggests that investors continue to give the bullish case the benefit of the doubt
The test and the benchmark
- Our test will identify those times when the S&P 500 Index gained 4.80% or more (using price only data) during the month of April
- We will then look at the performance for the S&P 500 Index during the remainder of the year (May through December)
- As a benchmark, let's first look at how the S&P 500 typically performs from May through December
The table below summarizes the performance of the S&P 500 Index during May through December of every year since 1931.
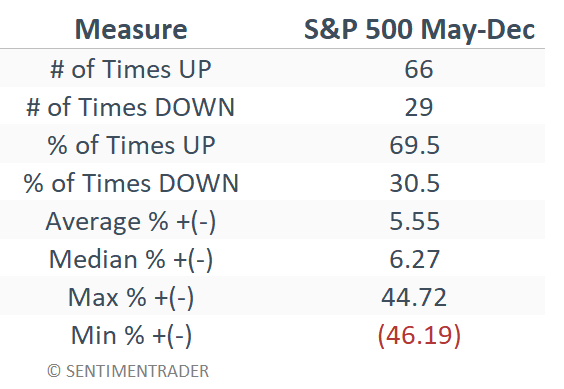
So, the key May through December benchmark numbers are that the S&P 500:
- Has gained ground from April 30th through December 31st 69.5% of the time
- Has sported a median gain of +6.27%
When the month of April is up +4.80% or more
The table below shows April performance and May through December performance for only those years since 1931 in which the S&P 500 posted a price gain of 4.80% or more in April.
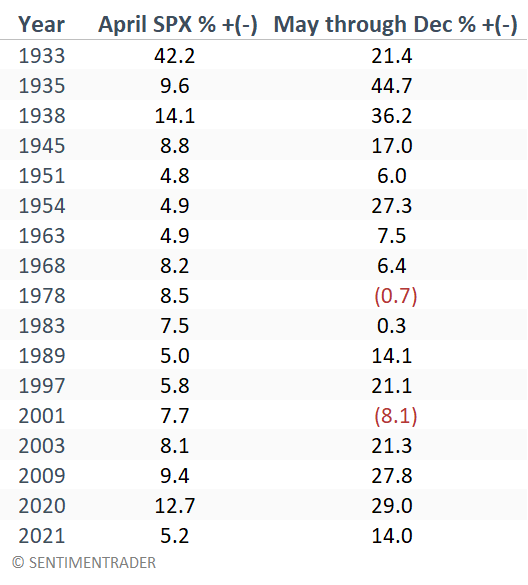
The next table summarizes the results from the table above.
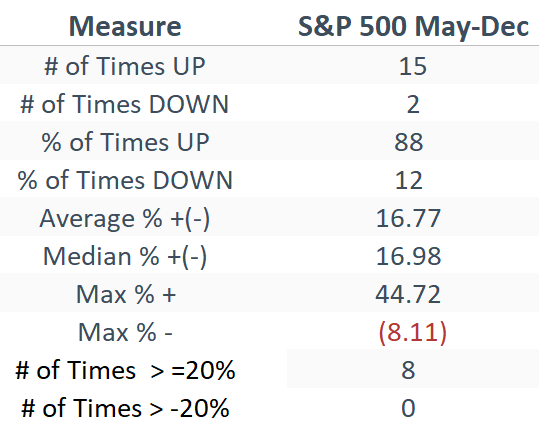
An 88% win rate and a median eight-month median gain of almost 17% is compelling, as these values far exceed the median values shown above. Also note that just over half (8 of 15) winning years showed a May through December gain of 20% or more.
The chart below shows the hypothetical growth of $1 invested in the S&P 500 Index only during May through December of the years listed in the table above to provide a sense of consistency.
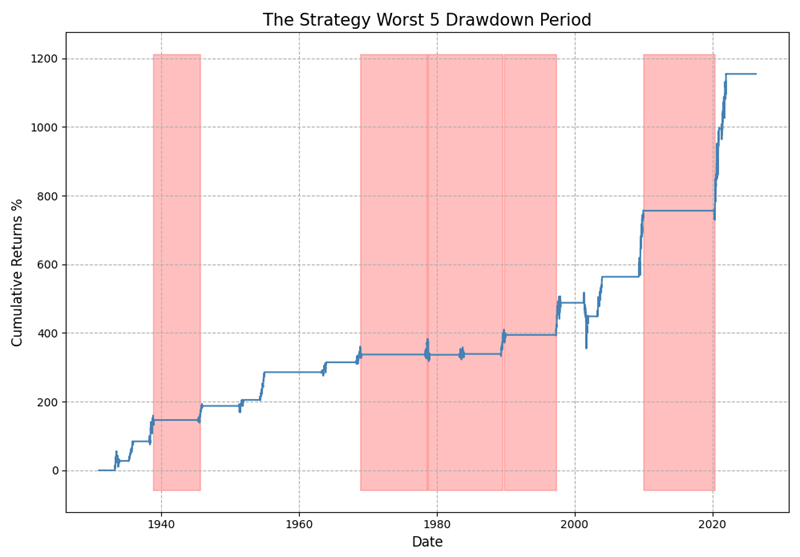
The bottom line is that while anything can happen in a given year, historically, there has not been a lot of major bear market action during May through December following an April gain in excess of +4.8%.
A word of caution
So, does the S&P 500 Index rising +5.2% during April 2025 ensure that the rest of 2025 is "smooth sailing" for stocks? Not at all. The chart below displays the performance of the S&P 500 during 2001. Note that after a +7.7% gain in April, the S&P 500:
- Suffered a -22.7% drawdown into the September low
- Closed the May-Dec period down -8.1%
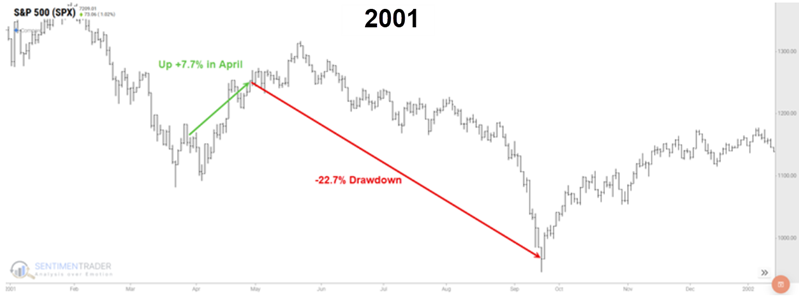
Also note that April 2008 saw an April gain of +4.75%, just south of our +4.80% cutoff. The S&P 500 proceeded to lose -34.8% over the next 8 months. So, again, there are no "sure things" in the market, only tendencies and trends.
What the research tells us…
The data detailed above does not, by itself, constitute a "trading system," or even a "trading signal," for that matter. It merely reinforces the adage that "strength tends to beget strength" in the stock market, thus lending weight to the bullish case for the remainder of 2026.
So, remember this:
- A strong performance during April lends bullish weight to the overall weight of the evidence
- But there are never any "sure things" in the market
The key for now is this: If price action starts to falter, investors should not necessarily dig in their heels and shout "but April was up a lot!?!" However, as long as price action holds up, investors should ignore the "gloom and doom" prognostications and avoid being shaken out of the market by ominous warnings of an impending market top.