
Another Useful Continuation Signal has Fired

Key points
- The stock market has run so far since the April 2025 low that many investors are worried that it can't continue
- However, a variety of recent "continuation" signals have appeared recently (see here). These types of signals can highlight trading opportunities for shorter-term traders and a chance to put more money to work in the market for longer-term investors
- Our % S&P 1500 RSI 14-day > 70 indicator offers recent examples
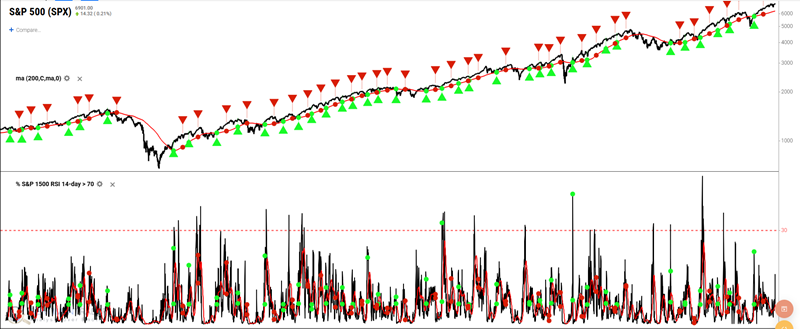
% S&P 1500 RSI 14-day > 70 indicator reverses from a low level
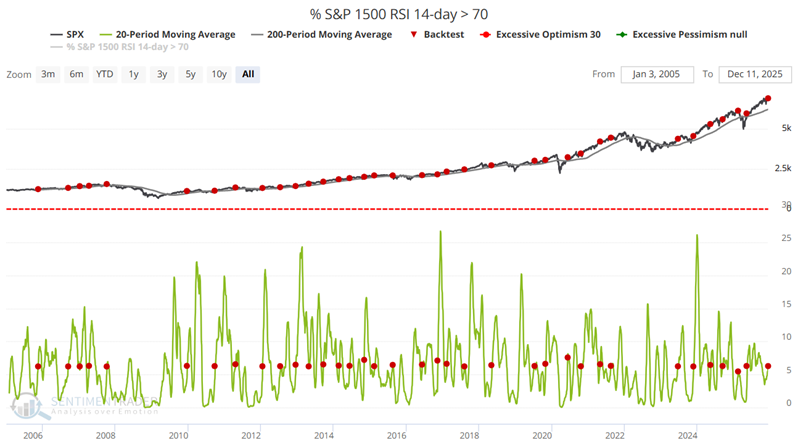
As the name implies, our % S&P 1500 RSI 14-day > 70 indicator reports each day the percentage of S&P 500 index constituent stocks that currently show an RSI reading greater than 70. Instinctively, many think of this in a contrarian fashion, i.e., the market must be overbought if so many stocks are showing extreme strength. However, more often than not, this type of strength serves as a sound momentum signal, particularly when it occurs within an established uptrend.
The chart below highlights all dates when:
- The 20-day moving average of the % S&P 1500 RSI 14-day > 70 indicator crosses above 6.2
- While the S&P 500 is above its 200-day moving average
The most recent signal occurred on December 11th.
Let's next create a strategy in BacktestEdge to utilize this setup for trading.
Building a strategic approach in Backtest Edge
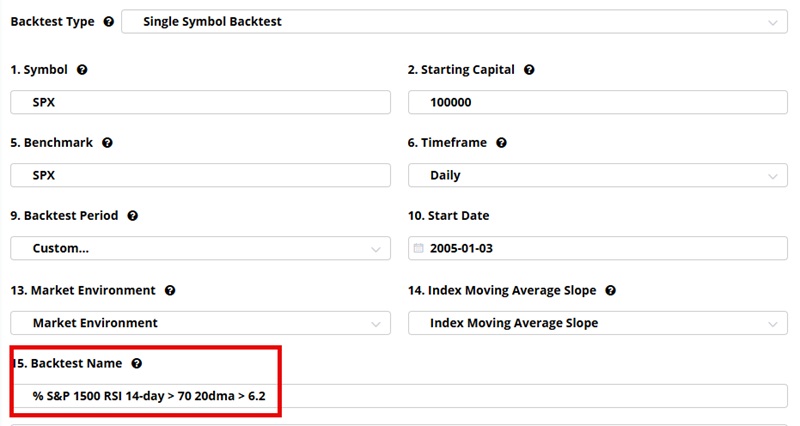
The test below can be found in BacktestEdge under Analyst Backtests. The following screens show the Setup steps to create a "Same Bar Multi-Condition test (which is already done for you under Analyst Backtests). The first screen names the strategy and sets a Start Date.
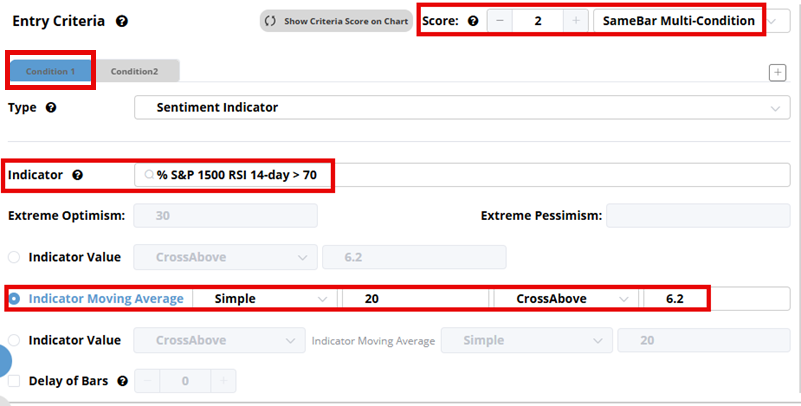
The screen below sets Condition 1, whereby the 20-day moving average for the % S&P 1500 RSI 14-day > 70 indicator crosses above 6.2.
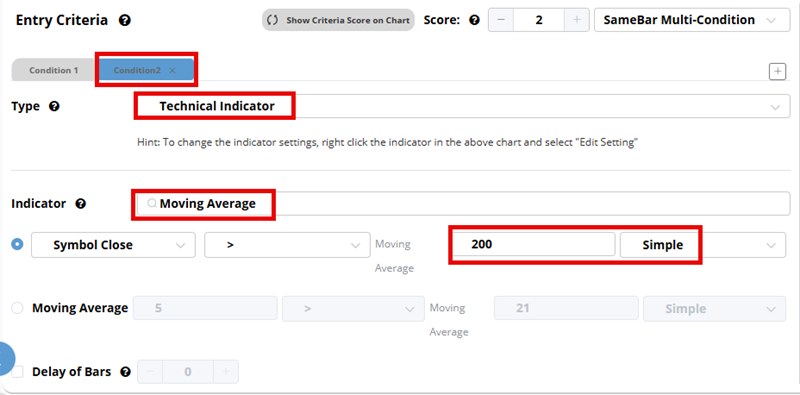
The screen below sets Condition 2, which requires the S&P 500 to be currently above its 200-day moving average.
In the screen below, we set up to exit the trade after 63 trading days. We could also consider setting a stop-loss % of 12% (In real-world trading, it is essential to consider and utilize stop-loss points). However, for the purpose of testing this setup, no stop-loss is used

Once everything is set up, we can click "Run Test" to generate results.
Analyzing the Strategy Test Results
The chart below displays all entry and exit signals for this test.
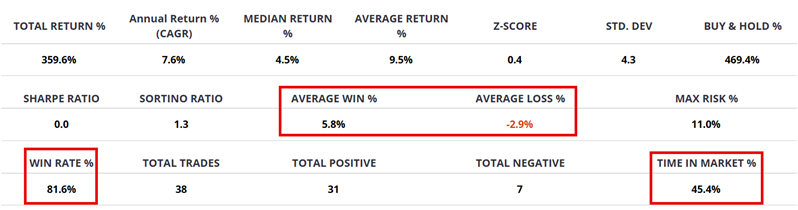
The table below summarizes the results of the entry and exit signals. The strategy is in the market roughly 45% of the time, with a Win Rate of 81.6%. The Average Win is two times the Average Loss.
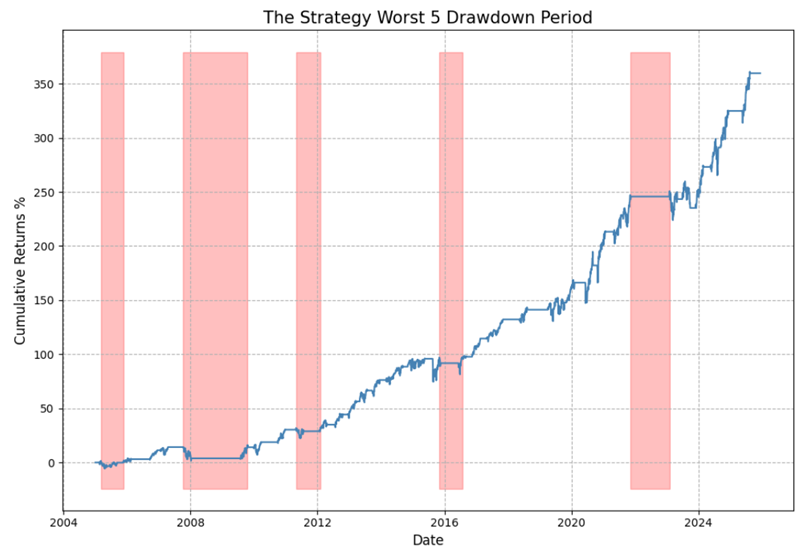
The chart below displays the hypothetical equity curve (i.e., the Cumulative % +(-)) achieved by holding the S&P 500 for 63 trading days after each new signal. The key thing to note is the "lower left to upper right" nature of the equity curve.
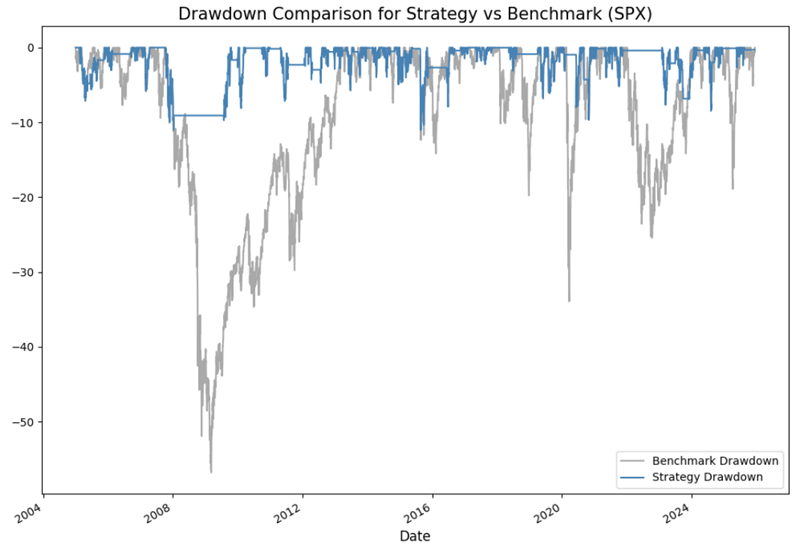
The chart below displays the hypothetical % drawdowns that would have been incurred while holding a long position in the S&P 500 between all entry and exit signals (blue line) versus the hypothetical % drawdown incurred using a buy-and-hold approach. The maximum intratrade drawdown for the strategy was -11.8%, compared to -55% for buy-and-hold.
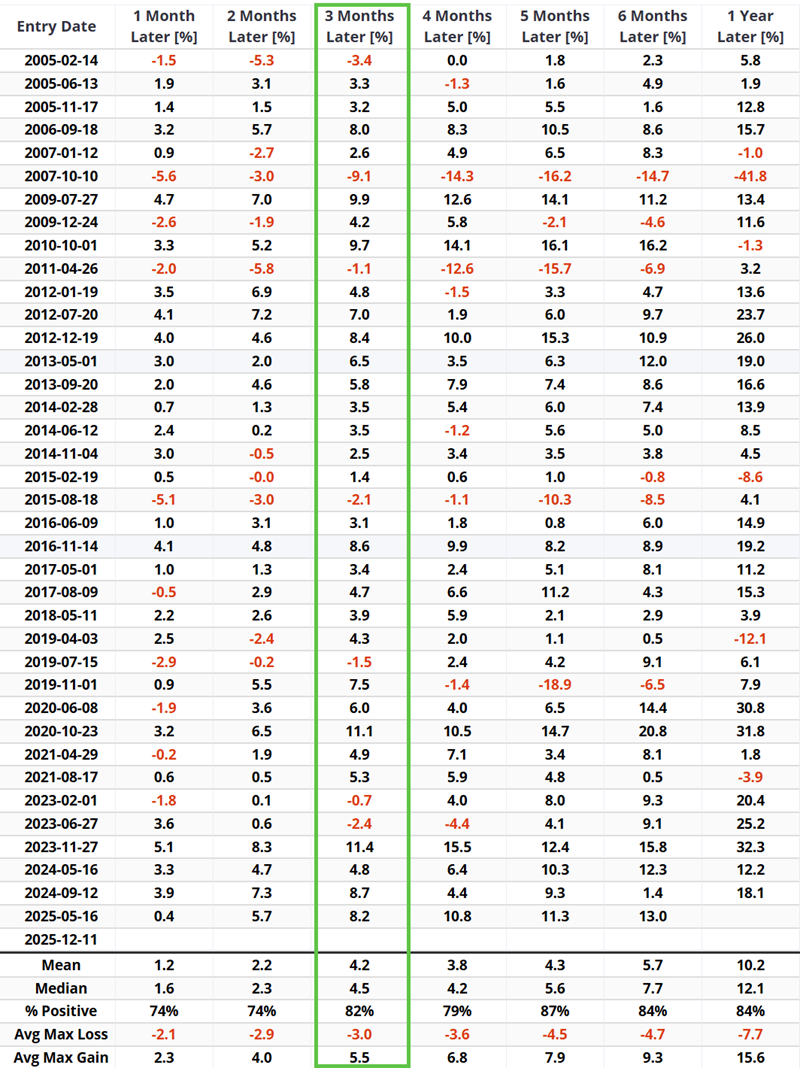
The table below displays returns by timeframe following each entry signal generated using the rules above. The 3-month returns are highlighted in the green box.
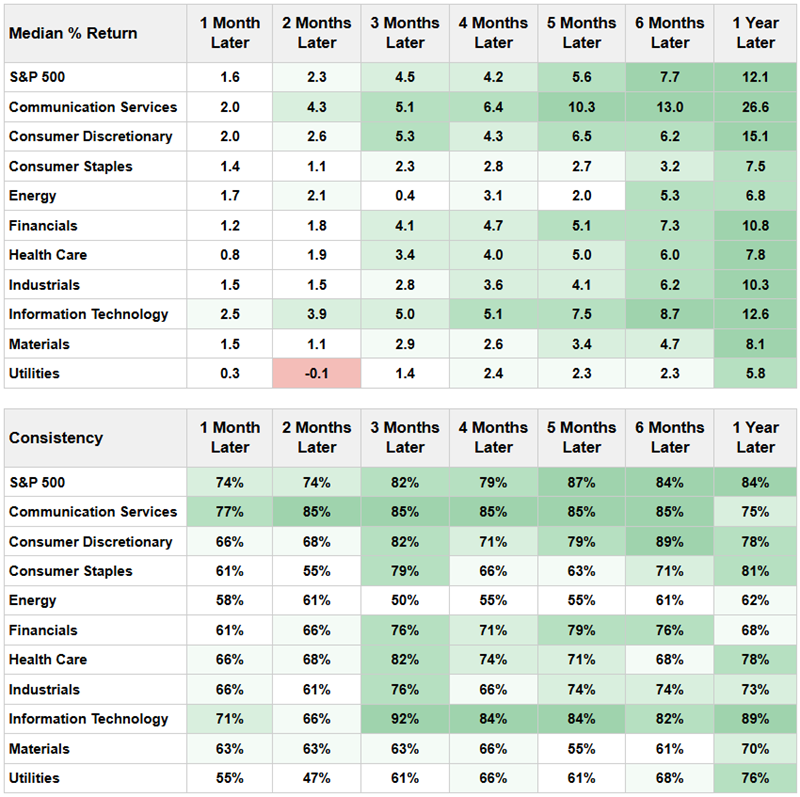
For comparison purposes, the performance of the S&P 500 and its various sectors is presented in the table below. While this test is designed to be traded using an S&P 500 index fund, it may be helpful to note that for the three-month time frame, the technology sector (represented by ticker XLK) has a higher Win Rate (92% versus 82%) and a slightly higher Median % Return (5.0% versus 4.5%).
What the research tells us…
Momentum is an essential factor in the stock market. The strategy highlighted here combines the concepts of looking for a pullback (a drop by the 20-day average of the indicator below 6.2%) followed by an upside thrust (a cross by the 20-day indicator average back above 6.2%) within the context of an ongoing favorable market trend (SPX close > 200-day moving average). No signal is ever guaranteed to work. Therefore, the recent signal does not imply that there is "easy money" to be made over the next three months. Likewise, individual traders are never relieved of their responsibility to allocate capital intelligently and manage risk ruthlessly. Nevertheless, the concept is sound, and the hypothetical backtest suggests a solid reward-to-risk tradeoff.