Products
SentimenTrader Trading Tools
‍
Backtest Engine
My Trading Toolkit
Correlation Analysis
Seasonality
Market Prediction
Indicators & Data API
‍
Proprietary Indicators & Charts
Market Data API
Strategies & Scanner
‍
50+ Trading Strategies
Smart Stock Scanner
Smart Option Scanner
Research Reports
‍
Research Solutions
Reports Library
Free Resources
Simple Backtest Calculator
Simple Seasonality Calculator
The Kelly Criterion Calculator
Sentiment Geo Map
Public Research Reports
Education
Sentiment Indicators
Technical Indicators
Pricing
Company
About
In the News
Testimonials
Client Success Stories
Contact
Log inLoginSign up
< BACK TO ALL REPORTS

Another step on the road to oversold

Jay Kaeppel
2022-05-20
Both the Nasdaq 100 and Russell 200 are getting into deeply oversold territory. The good news is that such action is often followed by robust returns 12 months later. The bad news is that getting there can be a bumpy road. This piece details the history and discusses how to approach the latest signals.

Key Points

  • Both the Nasdaq 100 and Russell 2000 indexes are finally nearing a level of "oversold" that is typically (though importantly, not always) followed by a reversal of fortune
  • Both indexes have now seen the % of component stocks above their respective 200-day moving averages fall to a significantly low level.

QQQ Breath (% > 200 Avg)

The chart below displays all days when the % of stocks comprising ticker QQQ (Invesco QQQ Trust) that were above their 200-day moving average was below 15% and the table displays the summary of QQQ performance in the ensuing 12 months.

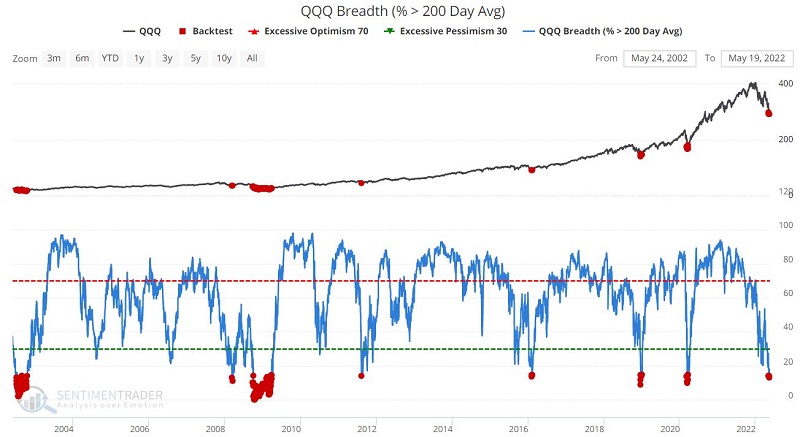
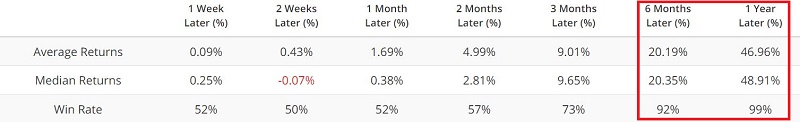
At first glance, the results look highly compelling (median 12-month return of +48.9% and 99% Win-Rate). However, this seems like a good time to invoke:

Jay's Trading Maxim #27: When it comes to trading/investing, there can be a chasm a mile wide between theory and reality.

First, the numbers are aided somewhat by the fact that there were many days below 15% leading up to the 2002 and 2009 lows. Secondly, signals in 2002 and 2008 were followed by extreme drawdowns between the initial signal and the actual low. Let's consider only the first new signal in four months to get a more realistic picture. The results appear below.

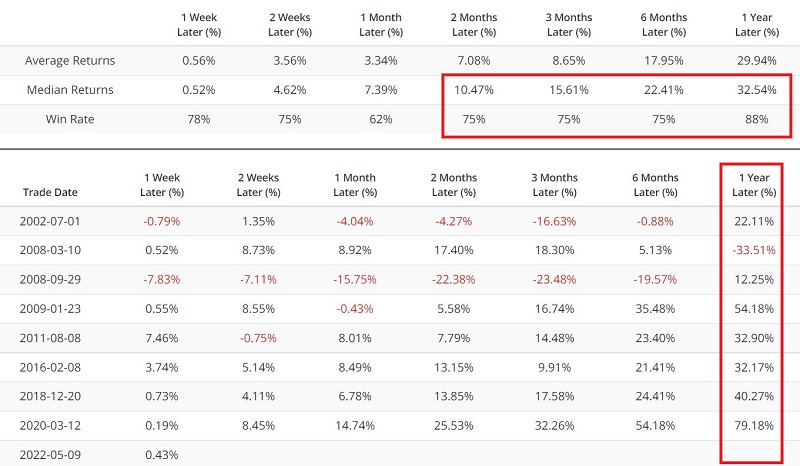
The numbers are similar but not quite as robust. Still, it is important to note the -33.51% 12-month decline following the 3/10/2008 signal.

The chart below displays the growth of $1 invested in QQQ 12 months after each signal date from the table above.

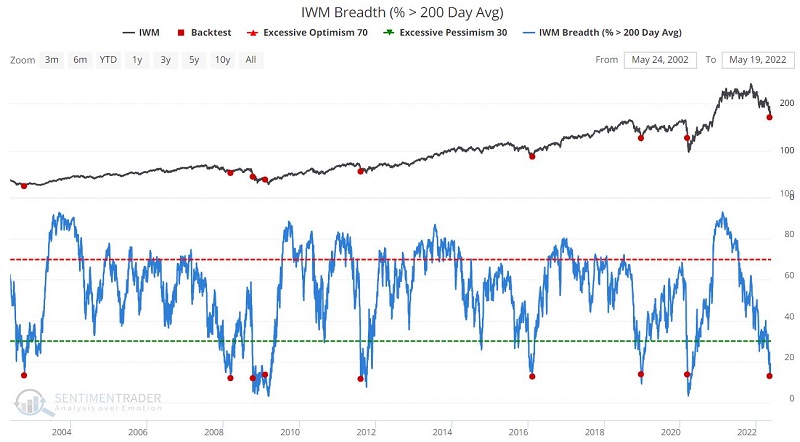
IWM Breath (% > 200 Avg)

The chart below displays all days when the % of stocks comprising ticker IWM (iShares Russell 2000 ETF) that were above their 200-day moving average was below 14% and the table displays the summary of QQQ performance in the ensuing 12 months.

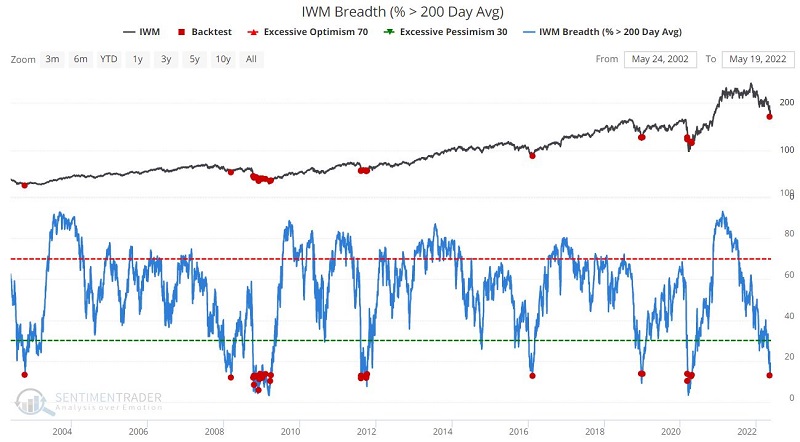
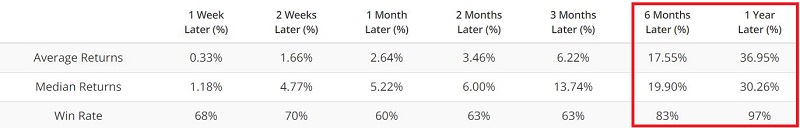
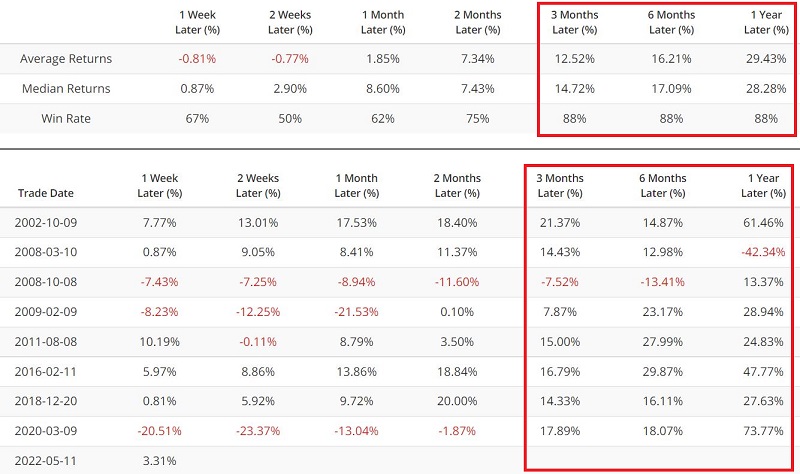
As we did with QQQ, let's consider only the first new signal in four months.

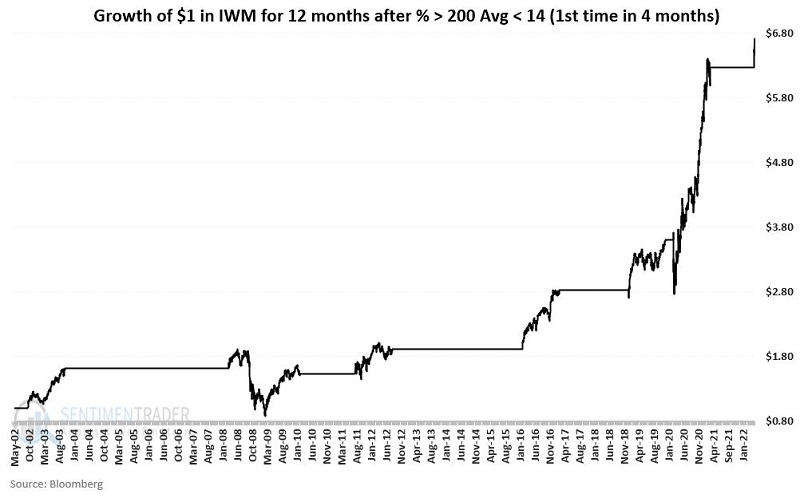
The chart below displays the growth of $1 invested in IWM 12 months after each signal date from the table above.

What the research tells us…

The good news is that a decline in the % of stocks in the indexes represented above has typically portended significantly higher stock prices in the year ahead. The bad news is that such a signal does NOT constitute an "All Clear" signal. Following a signal, things can - and often do - get notably worse before they get better.

Allocating capital conservatively and adhering to strict risk management is important when acting on the type of signals detailed above. 

PRODUCTS
SentimenTrader
Trading Tools
Indicators & Data API
‍
Strategies & Scanner
‍
Research Reports
FREE
RESOUrCES
Simple Backtest
Calculator
Simple Seasonality
Calculator
The Kelly Criterion
Calculator
Sentiment Geo Map
‍
Public Research Reports
‍
Education
Sentiment Indicators
‍
Technical Indicators
‍
Pricing
Bundle pricing
‍
FAQ
‍
Announcements
‍
COMPANY
‍
About
‍
In the News
‍
Testimonials
‍
Client Success Stories
CONTACT
‍
General Inquiries
‍
Media Inquiries
‍
Financial Professionals Inquiries
‍
© 2026 Sundial Capital Research Inc. All rights reserved.
Setsail Marketing
TermsPrivacyAffiliate Program
Risk Disclosure: The information and tools provided are for research and analytical purposes only and are not intended as investment advice. Market analysis involves uncertainty, and outcomes may differ from expectations. Users should conduct their own due diligence and consider their individual circumstances before making any financial decisions. Past performance is not necessarily indicative of future results.

Hypothetical Performance Disclosure: Hypothetical performance results have many inherent limitations, some of which are described below. No representation is being made that any account will or is likely to achieve profits or losses similar to those shown; in fact, there are frequently sharp differences between hypothetical performance results and the actual results subsequently achieved by any particular trading program. One of the limitations of hypothetical performance results is that they are generally prepared with the benefit of hindsight. In addition, hypothetical trading does not involve financial risk, and no hypothetical trading record can completely account for the impact of financial risk of actual trading. for example, the ability to withstand losses or to adhere to a particular trading program in spite of trading losses are material points which can also adversely affect actual trading results. There are numerous other factors related to the markets in general or to the implementation of any specific trading program which cannot be fully accounted for in the preparation of hypothetical performance results and all which can adversely affect trading results.

Testimonial Disclosure: Testimonials appearing on this website may not be representative of other clients or customers and is not a guarantee of future performance or success.