
Another short-term yellow and two longer-term green lights

Key points
- The NASDAQ Titanic Syndrome indicator just flashed a warning sign - which has tended to portend short-term market weakness
- On the other hand, the NASDAQ High/Low Ratio flashed a somewhat surprising favorable signal
- Lastly, despite the massive rally in stocks in 2023, our Panic/Euphoria Model just flashed a signal, which typically occurs after a significant market bottom
Masking sense of mixed signals
I am not good at market "predictions," so I will not attempt to make one here. That said, conflicting information is always available, and a person can always make a bullish or bearish case depending on how one interprets the data. Given that the stock market rallied for nine weeks in a row and a handful of typically helpful warning signs (see here and the information below), it would not be surprising if the market went through a period of choppy consolidation in the short term.
On the other hand, given the sheer volume of breadth thrust and momentum and trend-following indicators that have flashed green, it would also appear to make sense to continue to give the bullish case the benefit of the doubt. Again - short-term bearish but long-term bullish is not so much a prediction as it attempts to make sense of the current mixed bag of signals.
The NASDAQ Titanic Syndrome has signaled short-term headwinds in the past
Bill Omaha created the Titanic Syndrome in the 1960s. It highlights a technical market condition when stocks have recently been at a high, and then there is a sudden jump in new 52-week lows versus highs on the Nasdaq. For our purposes, we use the following conditions: 1) The Nasdaq 100 closed at a 52-week high at some point in the past seven sessions, and 2) New 52-week lows outnumber 52-week highs on the Nasdaq. It is a warning sign that typically precedes trouble over the next 1-3 months.
The chart below highlights those dates when the 150-day moving average of the NASDAQ Titanic Syndrome crossed below 0.1 for the first time in three months. The most recent signal occurred on 2024-01-02.
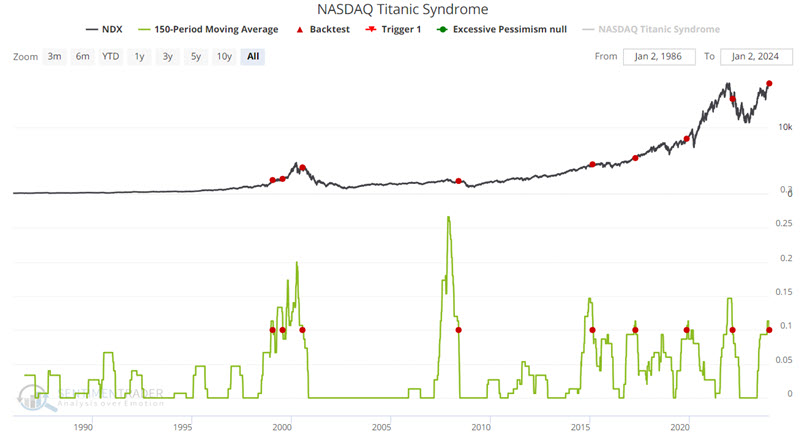
Individual days that qualify as NASDAQ Titanic Syndrome days often happen well before a top as the market starts to churn. By waiting for the long-term average to cross below 0.1, we are, in effect, delaying a signal until after topping conditions have played out for a while (at least that's the theory).
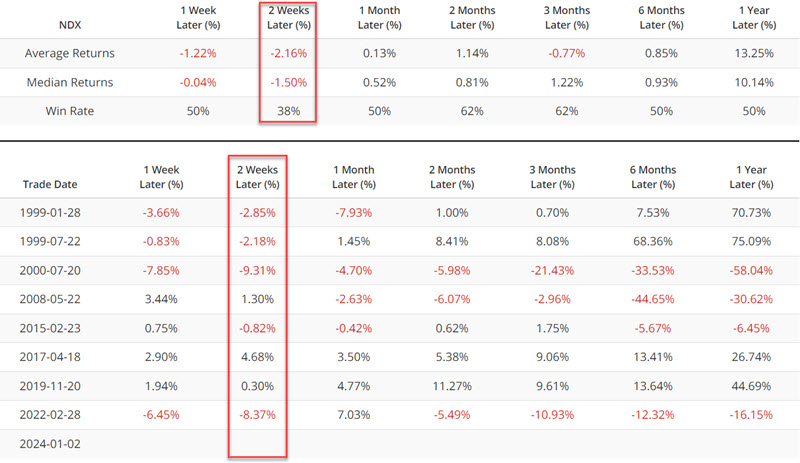
The table below summarizes subsequent Nasdaq 100 Index performance and displays results signal-by-signal. The 2017 and 2019 signals were incorrect. All others saw the Nasdaq 100 witness a sharp short-term selloff between one week and two months after the signal date.
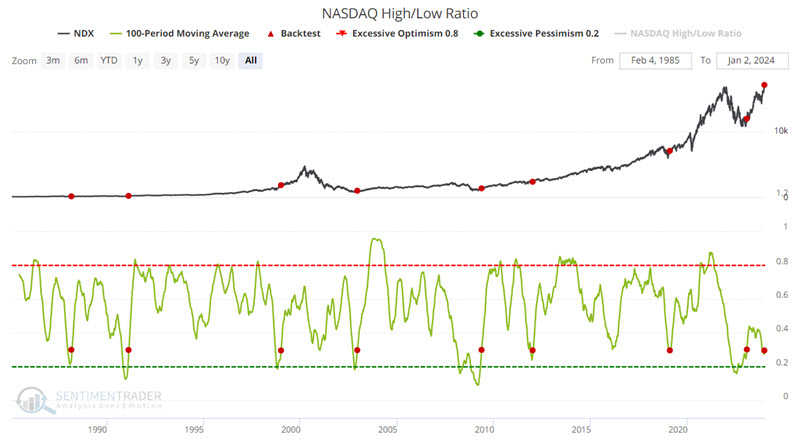
The Nasdaq High/Low Ratio flashes a major green light
While Nasdaq highs and lows appear to be causing potential short-term trouble, they may also have set the stage for another leg higher in 2024. The raw Nasdaq High/Low Ratio indicator looks daily at Nasdaq New Highs divided by Nasdaq New Highs and New Lows.
The chart below highlights those dates when the 100-day moving average of this indicator crossed above 0.29. The most recent signal occurred on 2023-12-27.
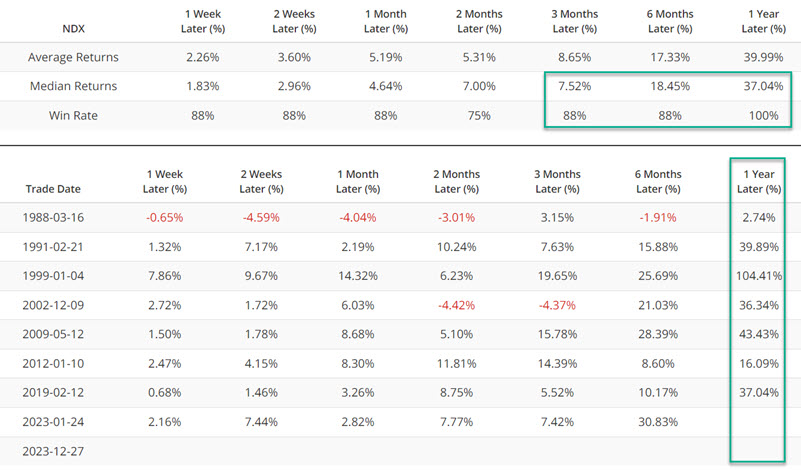
The table below summarizes subsequent Nasdaq 100 Index performance and displays results signal-by-signal. No indicator is ever guaranteed to work "this time around," and this one is no exception. That said, the robust nature of 1-year returns is hard to overlook (a 100% Win Rate and a Median Return of +37%, not including the near +40% NDX gain since the previous signal on 2023-01-24).
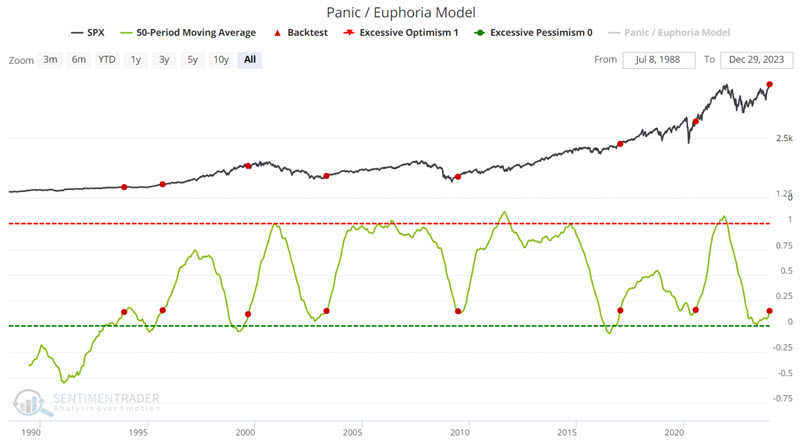
Panic/Euphoria Model suggests there is still enough doubt to fuel a further rally
Pundits often use sentiment anecdotally to help to try to make their case. Some point to the recent spike in the Fear & Greed Model and the NAAIM Exposure Index (a VERY misunderstood indicator) to argue that sentiment is a warning of a significant market top. However, our Panic/Euphoria Model - which typically plays out in much longer-term waves, particularly when a 50-day average is applied - has flashed another favorable signal.
The chart below highlights those dates when the 50-day moving average for the Panic/Euphoria Model crossed above 0.14 for the first time in six months. The most recent signal occurred on 2023-12-29. This suggests that the overly bullish sentiment that typically marks a major (rather than a short-term) market top is a long way off.
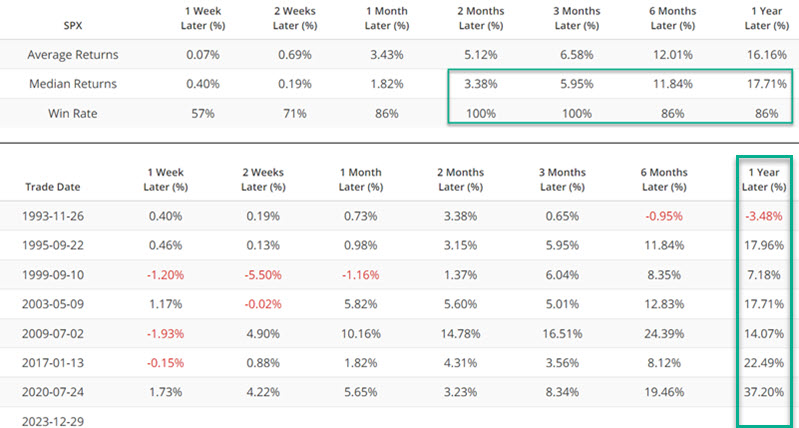
The table below summarizes subsequent S&P 500 Index performance and displays results signal-by-signal. Once again, nothing is ever guaranteed, but the results argue continuing to give the bullish case the benefit of the doubt.
What the research tells us…
The relative weakness in Nasdaq New Highs versus New Lows despite the massive gain for the Nasdaq 100 Index and the Nasdaq Composite Index in the last year is puzzling. The key to useful analysis is to be as objective as possible. From this perspective, the high/low conundrum is troubling in the near term, but - based on the history of the Nasdaq High/Low Ratio indicator highlighted above - it could set the stage for another decent year. The Panic/Euphoria Model status suggests that overall investor sentiment is not overly elevated and that the market can still climb "the wall of worry."