
Another sector to watch closely in January

Key points
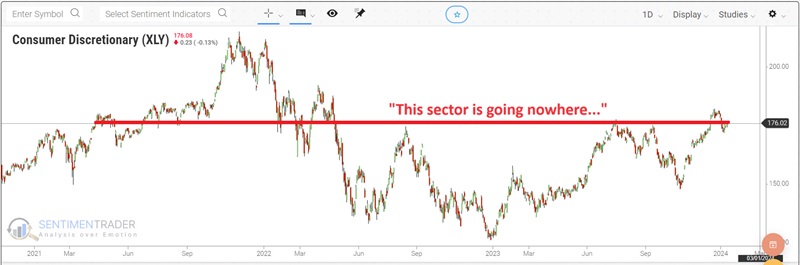
- The Consumer Discretionary sector has traded sideways in a large trading range for almost three years...
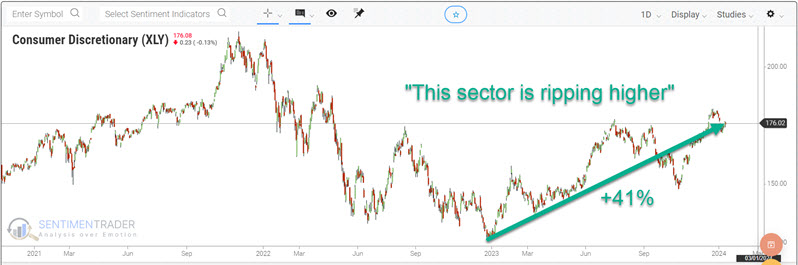
- ...and has also rallied sharply in the past 15 months
- A strong January for this sector typically portends good things for the next twelve-month
Consumer Discretionary is going nowhere...AND charging higher
There is a contradiction in terms. Yet a trader could make a compelling argument for both assertions. The charts below display the same price action for the Consumer Discretionary Select Sector SPDR Fund ETF (ticker XLY) - from two entirely different perspectives. The first highlights that XLY is unchanged from its price level almost three years ago.
The second chart focuses on the fact that XLY is now over 40% higher than its October 2022 low.
So, which is the proper take? Well, that's the thing about the market. One's view of the market is entirely in the eye of the beholder. Will XLY follow through on the rally since late 2022, or will it continue to chop sideways in a large trading range? We cannot predict. However, we can point out that the sector's performance during January 2024 may offer an important clue.
The January Barometer… for Consumer Discretionary
As January goes, so goes… the consumer discretionary sector? Said possibly no one ever. The chart below shows that the gain in January 2023 was followed by continuation to a higher price level (albeit in a somewhat choppy matter). XLY is presently more than +19.4% above its close at the end of January 2023 (versus +17.5% for the S&P 500 Index). But as you can also see in the chart below, the Consumer Discretionary Select Sector SPDR Fund ETF (ticker XLY) has struggled so far in 2024.
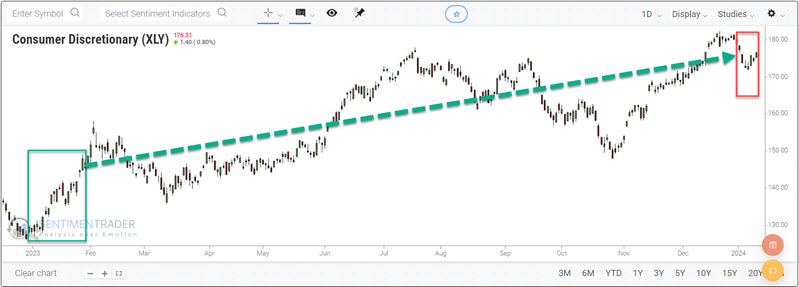
Does this matter? History suggests that if this sector can turn it around and close the month of January with a gain, it bodes very well for the sector for the rest of the year.
We will test this theory using the FAMA French Index for consumer discretionary from 1944-12-31 into 1991 and the S&P 500 Consumer Discretionary Index. We will first look at the performance of the consumer discretionary sector from the end of January through the end of December only if the consumer discretionary sector has shown a gain for January since 1945.
Based on the January results, we will measure sector performance over the next 12 months - i.e., through the end of January the following year. For example, January 1945 saw this sector witness a gain. Based on this result, we will buy and hold the consumer discretionary sector for 12 months through the end of January 1946. We will keep two cumulative tallies - one for "up" January and another for "down" January.
The chart below displays (on a logarithmic scale) the growth of $1 invested in the consumer discretionary sector for 12 months if the sector showed a gain during January. The initial $1 grew to $2,038 (or +203,691%).
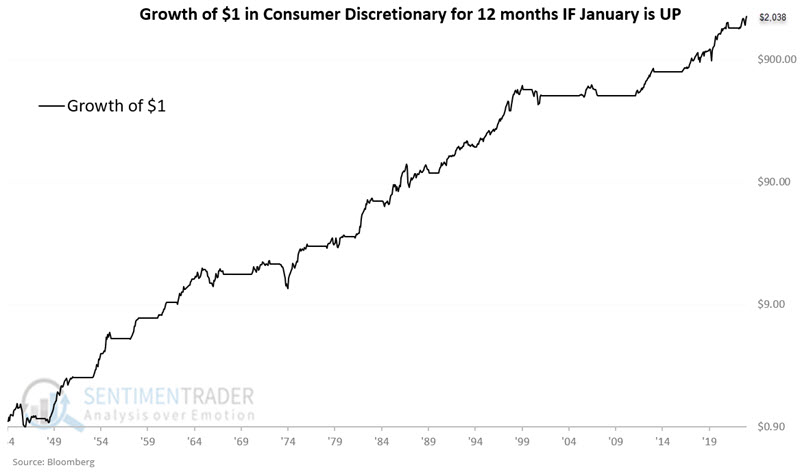
The table below summarizes the consumer discretionary sector performance from January 31st through January 31st the following year if January showed a gain.
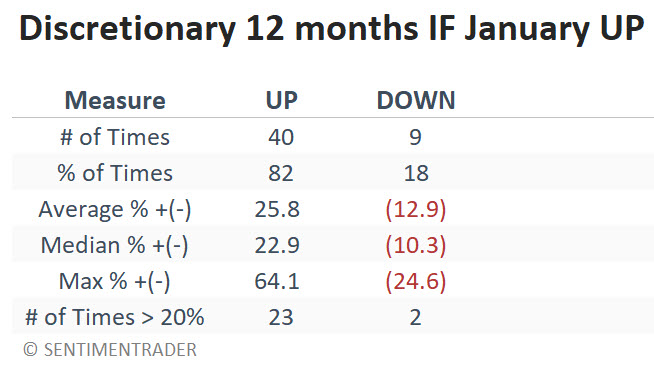
As always in the markets, nothing is a sure thing. During 9 of the 49 years (18% of the time) when consumer discretionary showed a gain during January, we have witnessed a decline in the next twelve months. This includes a 12-month loss of -24.6% in 1946-47, -23.1 in 1974-75 and - and -19.2 in 1966-67. Nevertheless, the Win Rate (82%) and Average and Median results skew heavily to the positive side (better than 2-to-1). The most compelling result is that 23 of the 49 years witnessed a gain of +20% or more, versus just two years with a decline of greater than -20%.
The "other" years
For the sake of comparison, the chart below displays the growth of $1 invested in the consumer discretionary sector for 12 months if the sector showed a loss during January since 1945.
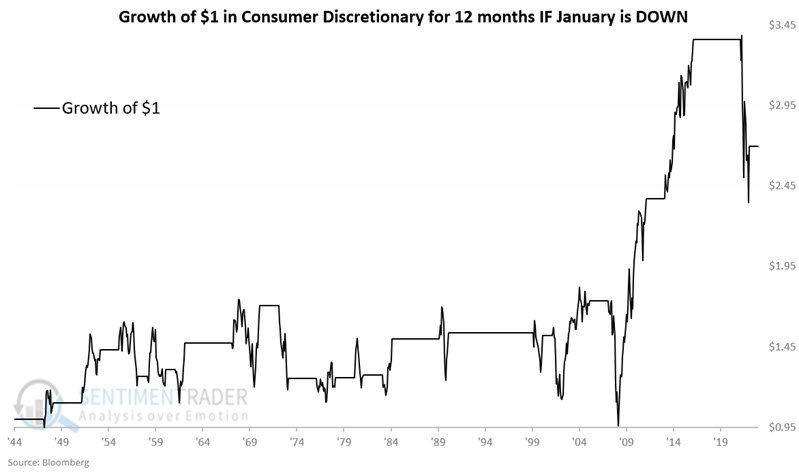
The long-term result is not terrible, as the equity curve works from the lower left to the upper right. Still, a closer look reveals many severe bear market declines and that most of the net gain occurred between 2009 and 2017. Likewise, while $1 invested only following up January's grew to $2,038, $1 invested only following down January's grew to just $2.70 (or +170% versus +203,691% following up January's). The table below summarizes results during "down January" years.
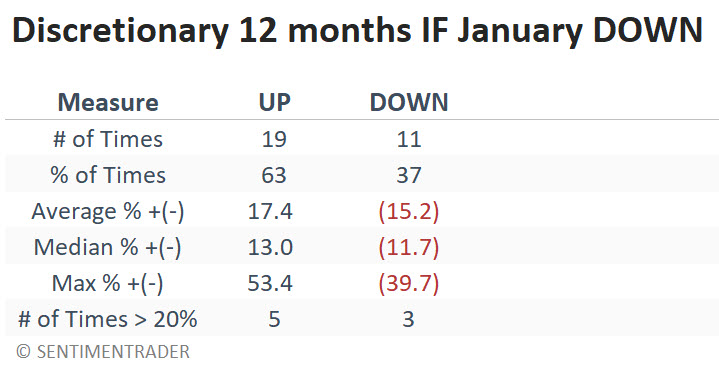
While a down January for consumer discretionary may not necessarily result in a bear market decline, it is also not a compelling reason to buy and hold consumer discretionary stocks in nearly the same way an up January appears to be.
What the research tells us…
The consumer discretionary sector has essentially traded sideways for almost three years. There is no guarantee that the most recent rally that started in October 2023 will continue to follow through as XLY faces some significant overhead resistance. Nevertheless, history suggests that a positive showing in January might mean good things for this sector over the next year.
Bottom line: Pay close attention to the consumer discretionary sector between now and January 31st.