
Another round of oversold indicators

Key points
- As the stock market has plunged, many reliable indicators flashed "oversold" signals
- Many of these individual signals do not necessarily qualify as standalone "buy" signals, but taken together, they do suggest not giving in completely to panic and fear
- This note looks at recent signals from our Stock/Bond Ratio, Intermediate-Term Optimism, and VIX Term Structure indicators
Where we stand
Repeating from previous notes: I follow hundreds of indicators and over a thousand potential "signals" they can trigger. After the close on Friday, April 4th, my scan lit up with many signals, mostly all "favorable." That's the good news. The bad news is that, in this case, a "signal" is primarily "weight of the evidence" and not necessarily an outright "buy signal." Likewise, many of the signals that triggered fall into the category of "typically favorable (i.e., 80% of higher Win Rate) six to twelve months out." But what happens in the interim is a) often close to a coin flip, and b) there is no guarantee that things won't get worse (sometimes even much worse) before they get better.
Keeping that in mind, let's look at some more valuable indicators that recently generated such signals.
The Stock/Bond Ratio plunges
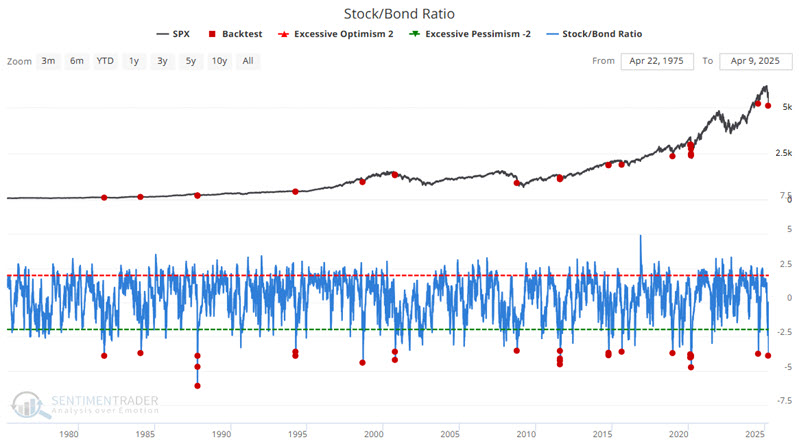
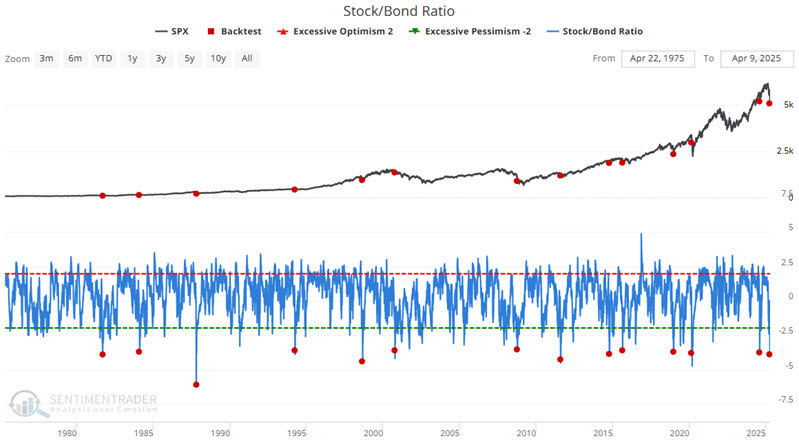
The chart below displays all dates when our Stock/Bond Ratio indicator was at -3.5 or lower.
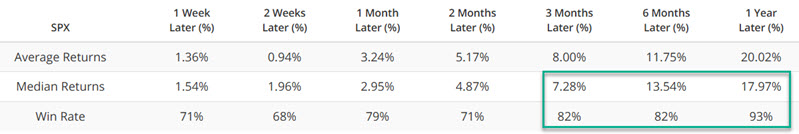
The table below summarizes the results.
To eliminate some overlaps, the chart and table below present results only for signals that occur for the first time in three months.
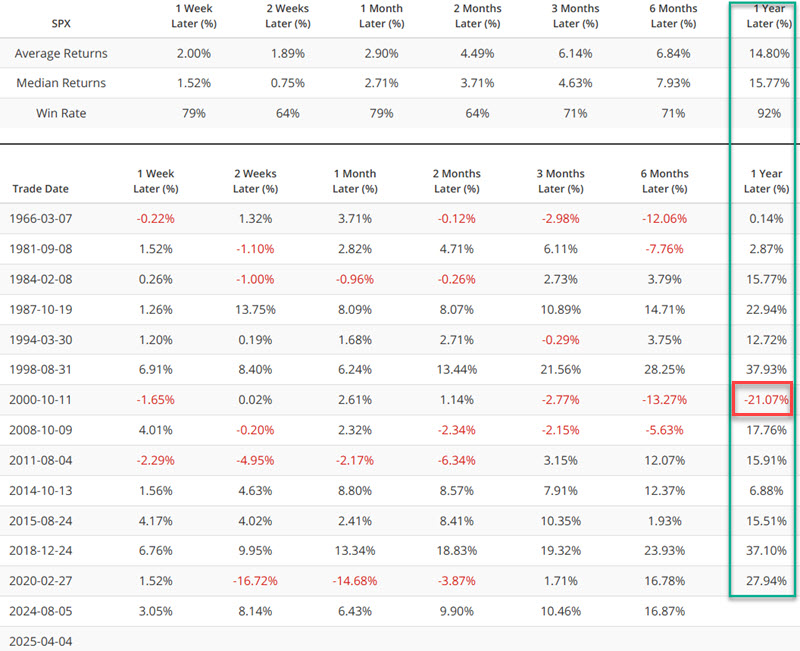
As you can see above, this signal does not guarantee an immediate rally. However, the 12-month Win Rate of 92% since 1966 and the Median Return of 15.77% are compelling.
The Intermediate Term Optimism Index signals massive pessimism
The chart below displays all dates when our Intermediate Term Optimism Index was below 20 for the first time in 21 days.
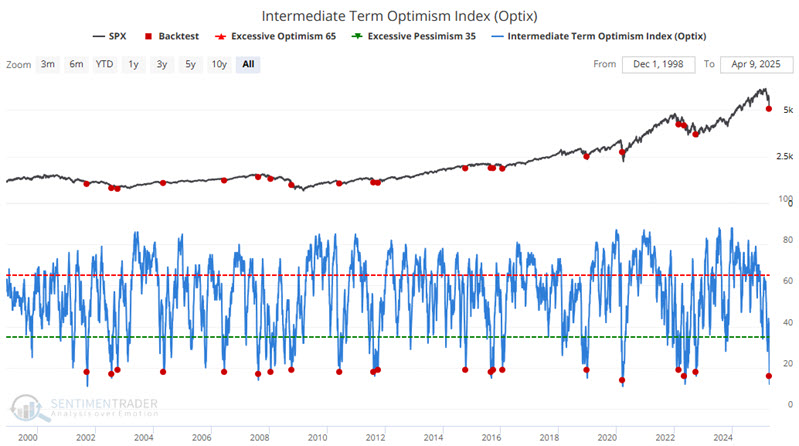
The below summarizes the results. Note the consistent and above-average results one and two months after a signal.
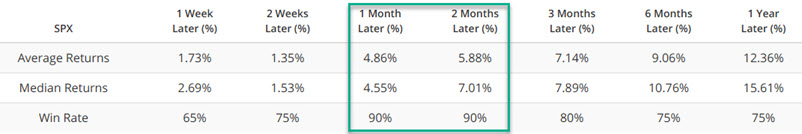
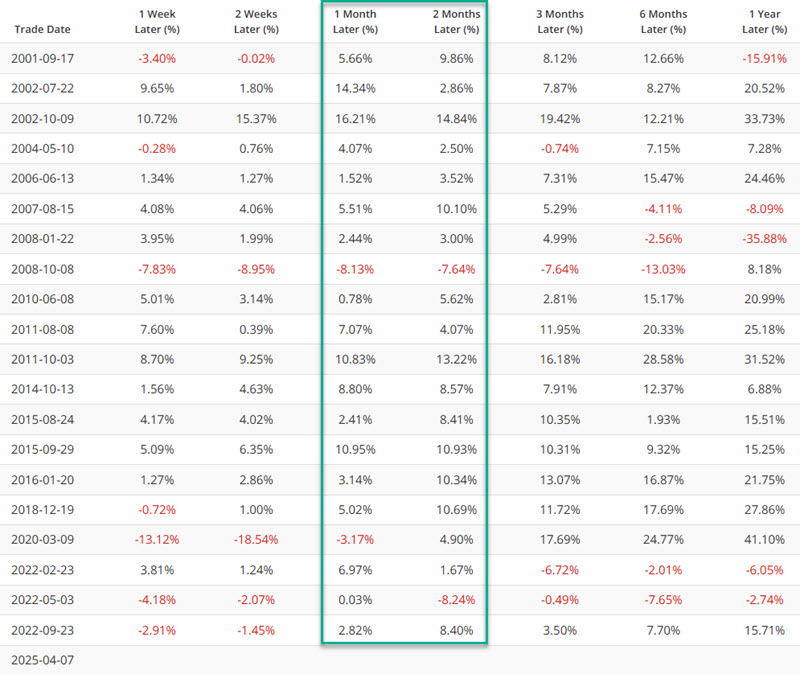
The table below displays S&P 500 performance following all signals, including overlaps.
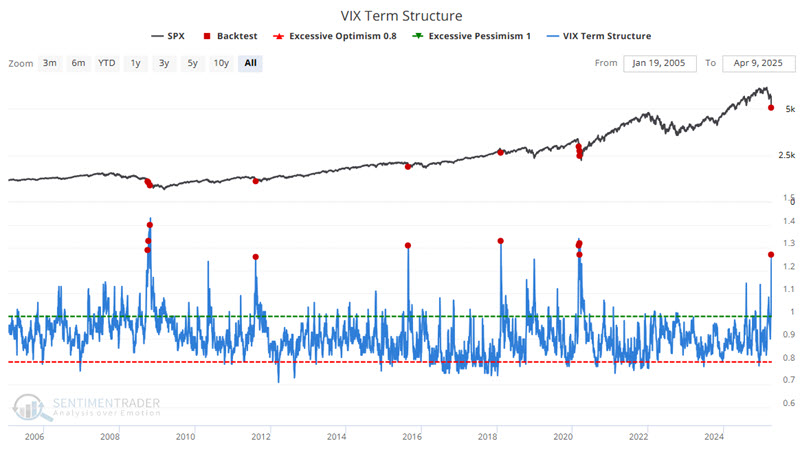
VIX Term Structure has spiked
It's rare to see futures contracts that don't expire for a while lower-priced than the near-term futures. For this indicator, we're comparing the 1-month VIX futures to the 3-month VIX futures (where futures traders think the VIX will be priced in 3 months), a way of looking at what is called "term structure."
The spread will be high if futures traders think volatility will spike in the near term. Usually, this occurs during times of panic. When futures traders are pricing in much higher volatility levels (i.e., the blue indicator goes above the green dotted line), then it means that traders are panicking and pricing in high amounts of near-term volatility. It usually doesn't pan out that way - stocks often bottom soon after the ratio reaches 1.0 or 1.2 in times of actual duress. When futures traders are pricing in lower near-term volatility (i.e., the blue indicator goes below the lower red dotted line), it's a sign of complacency, and stocks often have trouble rewarding that going forward.
The chart below highlights all dates when the VIX Term Structure crossed above 1.25.
The table below summarizes the S&P 500's performance following previous signals. In most previous instances, the market struggled significantly in the first two months after the signal, only to come roaring back three to twelve months after the initial signal.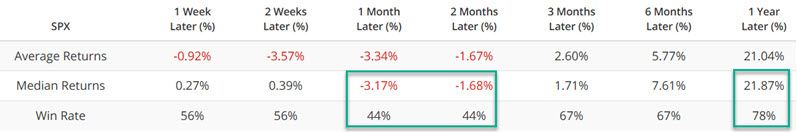
The table below displays results on a signal-by-signal basis.
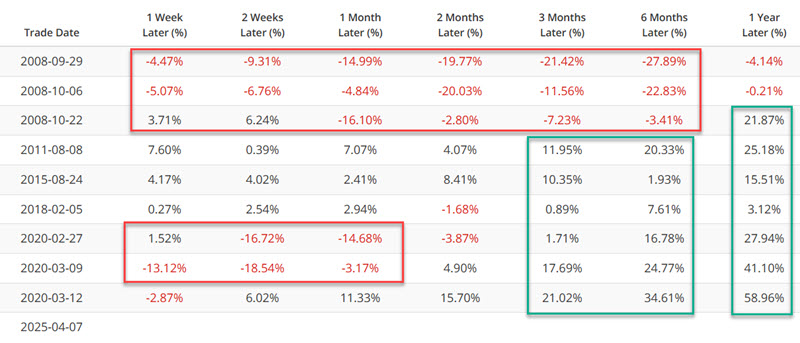
Note the overall subpar results during the two months after a signal. One concern in the current situation is that the stock market may flounder and remain volatile as it searches for a bottom unless and until some true clarity emerges regarding tariffs-the results above fit in with this potential scenario.
What the research tells us…
The fear overwhelming the markets of late is based on the concern that recent events are not "business as usual." The bearish argument at present is that the proliferation of tariffs will lead to a global trade war, which will lead to a worldwide economic slowdown, which could lead to a global depression. I cannot state whether this is true or false. Nevertheless, traditional indicators of breadth and sentiment are lining up abundantly on the favorable side of the weight of the evidence ledger. Make of it what you will.