
Another retail stock shows extreme pessimism

Key points:
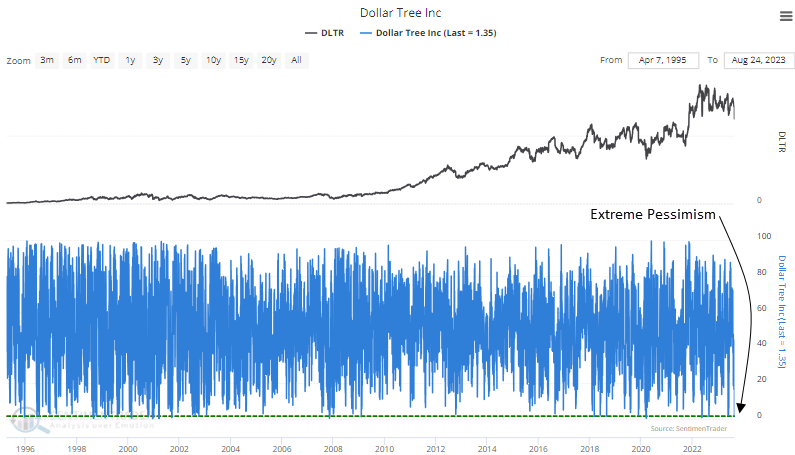
- The Optimism Index for Dollar Tree (DLTR) plunged to one of the lowest levels in history
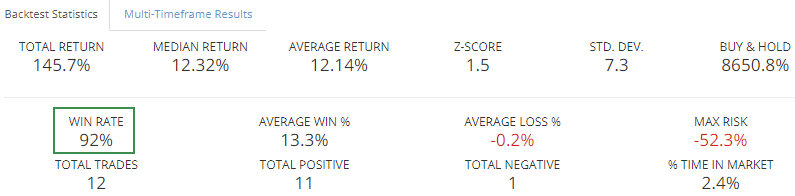
- Similar sentiment extremes resulted in a 92% win rate over the subsequent three weeks
A historic level of pessimism
Dollar Tree, a discount retail store chain, plunged more than 12% after issuing a weaker-than-expected profit forecast. The downdraft in the stock sent the Optimism Index to the 20th lowest level in history.
Let's run a backtest engine study to assess the outlook for DLTR when the Optimism Index crosses below 1.5%.
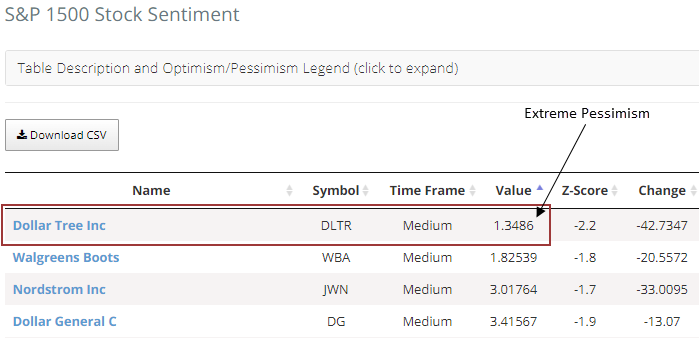
Website data visualization
Users can sort our website's S&P 1500 Optix page to identify stocks exhibiting extreme optimism or pessimism. After the close of trading on Thursday, Dollar Tree had the lowest value of any member in the S&P 1500.
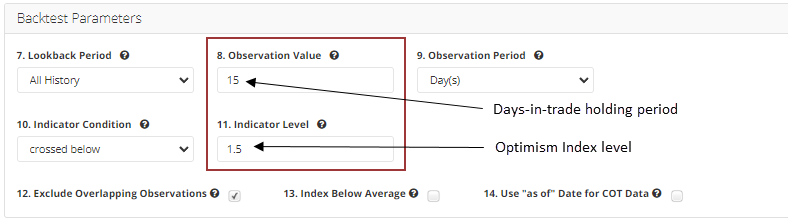
Backtest engine
Designed with a user-friendly interface that requires no programming skills, backtest engine parameters can be quickly adjusted with a mouse click or stroke of a key. In the case of Dollar Tree, I'll apply an Optimism Index cross below 1.5% and a holding period of 15 trading sessions.
Backtest statistics
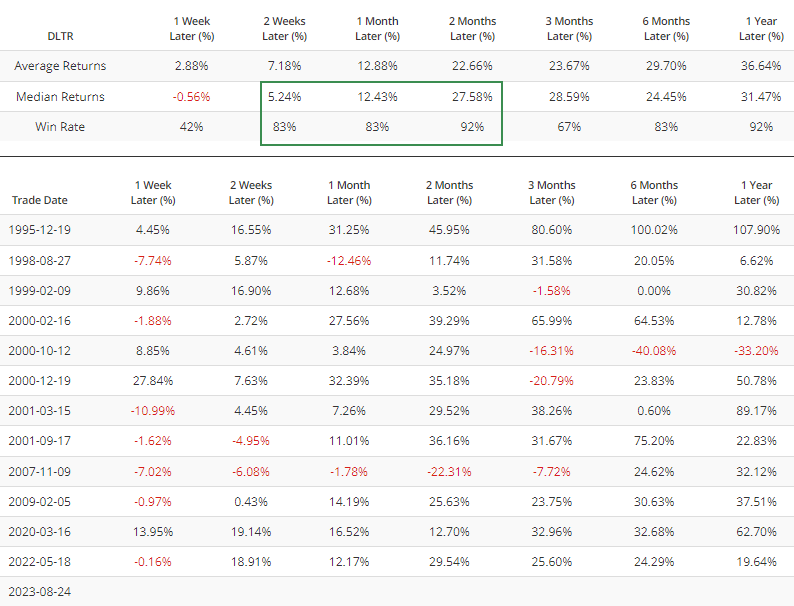
The backtest engine statistics for our pre-defined holding period show a 92% win rate over the next three weeks, with the average and median return exceeding 12%.
Multi-timeframe results suggest the stock could remain soft over the next week. However, from two to eight weeks later, Dollar Tree shows a solid tendency to bounce back, similar to our pre-defined holding period.
What the research tells us...
The Optimism Index for Dollar Tree plunged to one of the lowest levels in history, indicating extreme pessimism. After similar sentiment conditions, the stock tended to rally from two to eight weeks later.
With our proprietary indicators, informative data visualizations, and robust backtest engine, investors can rapidly and proficiently analyze trading ideas similar to the one presented in today's research note.