
Another momentum measure flashes green (through end of 2024)

Key points
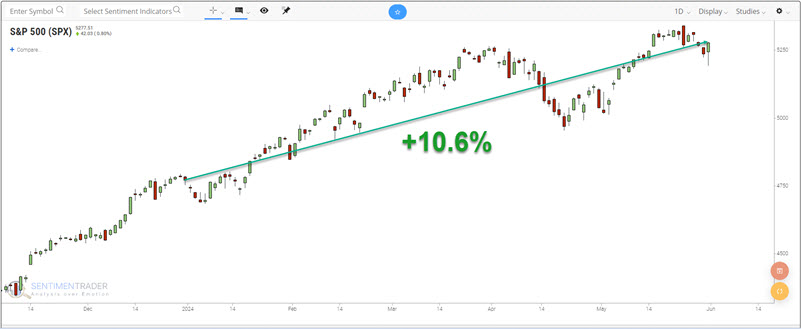
- The S&P 500 Index closed May with a year-to-date gain of +10.6%
- Historically, a strong first five months of the year bodes well for the last seven months of the year
- Does this mean "smooth sailing?" Not necessarily
Assessing the year-to-date at the end of May
The S&P 500 Index closed the month of May at 5,277.51, up +10.6% so far for calendar 2024.
Does this affect market performance during the remainder of the calendar year? Some evidence suggests that the answer is "Yes."
We will focus below specifically on the performance of the S&P 500 Index during the last seven months of the year only if the index showed a year-to-date gain of +5% or more as of the end of May.
The columns in the table below display the following information:
- The year if the S&P 500 Index closed May with a year-to-date gain of 5% or more
- The cumulative percentage gain or loss for the S&P from the end of May through the end of December
- The most significant decline during June through December from the closing price at the end of May (i.e., the worst open loss an investor who bought the S&P 500 Index at the end of May would have experienced during the remainder of the year)
- The most significant peak-to-valley drawdown from any peak during June through December
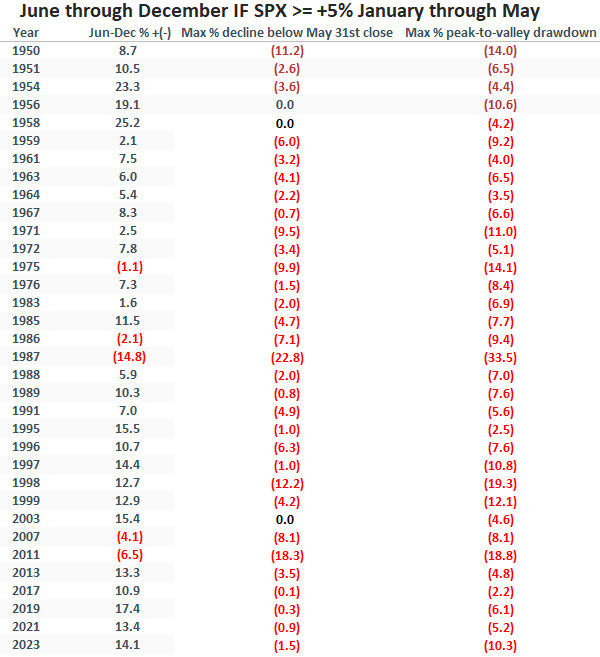
One of the key things to note from a "real-world trading" perspective is that four times the S&P 500 experienced a drawdown from the May closing price of -10% or more (-11.2% in 1950, -22.8% in 1987, -12.2% in 1998, and -18.3% in 2011). The bottom line: Despite the overall favorable results (more on that in a moment), there is no such thing as "easy money" or "sure things" in the stock market.
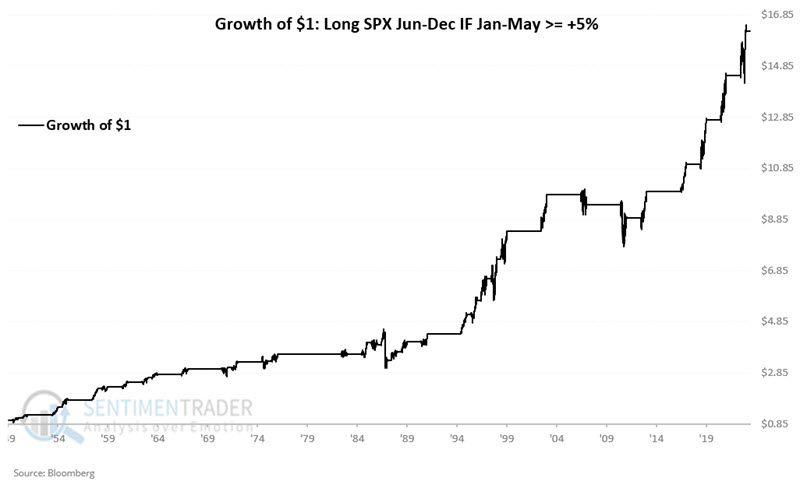
The chart below displays the hypothetical growth of $1 invested in the S&P 500 Index only during Jund through December of the years listed in the table above. The equity curve's favorable long-term "lower left to upper right" nature is unmistakable. That said, a closer examination reveals some significantly sharp declines along the way.
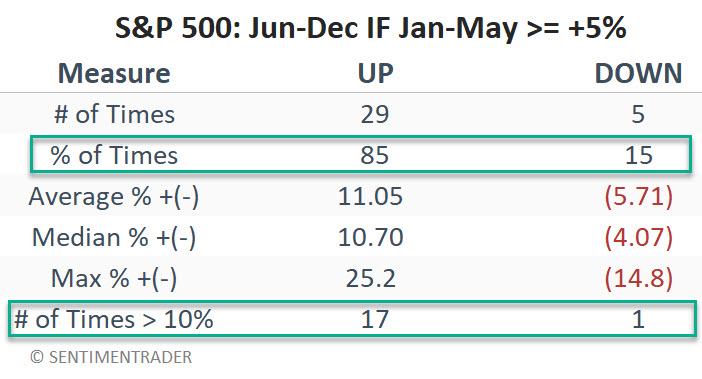
The table below summarizes S&P 500 performance from the end of May through the end of December during the years listed in the table above. The key things to note are the 85% Win Rate and that June through December moves over 10%, skewed to the positive side by a factor of 17-to-1.
Comparing this period to all 7-month periods
While the results above appear compelling, to get a true sense of performance, let's compare it to the average performance for the S&P 500 Index over all rolling seven-month periods starting at the end of 1949. The comparative results appear in the table below.
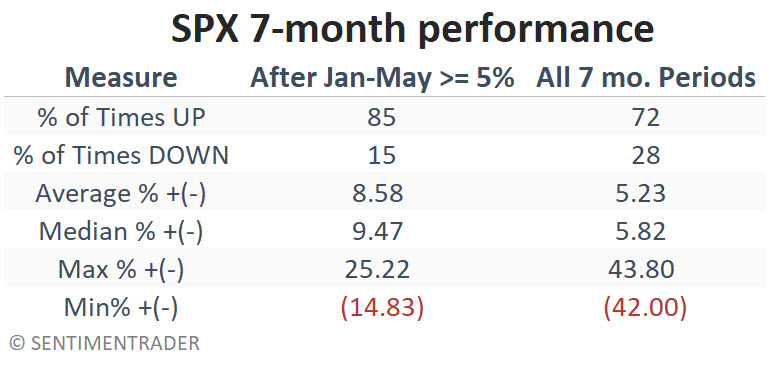
Note the significantly higher Win Rate, Average % +(-), and Median % +(-) for the June through December periods that follow a 5% or more gain during the year's first five months. The results in the two tables above suggest (but do not guarantee) that the odds favor bullish investors when the S&P gains 5% or more through the end of May.
What the research tells us…
The bottom line is that overall, the S&P 500 has tended to perform well from the end of May through the end of December, following gains of 5% or more during the first five months of the year. That said, it is essential to view the information above as "weight of the evidence" and not as some automatic "bullish" or "buy" signal. The favorable signal that occurred at the end of May 2024 as the result of the S&P showing a +10.6% gain year-to-date falls firmly on the favorable side of the ledger. It does not, however, guarantee a higher market for the rest of the year.