
Another look at margin debt extremes

Key points
- Margin debt is a rare indicator that can be used as a sentiment indicator and as a trend-following indicator
- Dean recently highlighted a beneficial timing reversal with important implications for long-term investors
- This piece highlights two other ways to look at margin debt trends - one bullish, one bearish
NYSE Margin Debt % Growth
The chart below displays the NYSE Margin Debt % Growth indicator. This indicator shows the 12-month rate of change percentage in margin debt among U.S. investors.
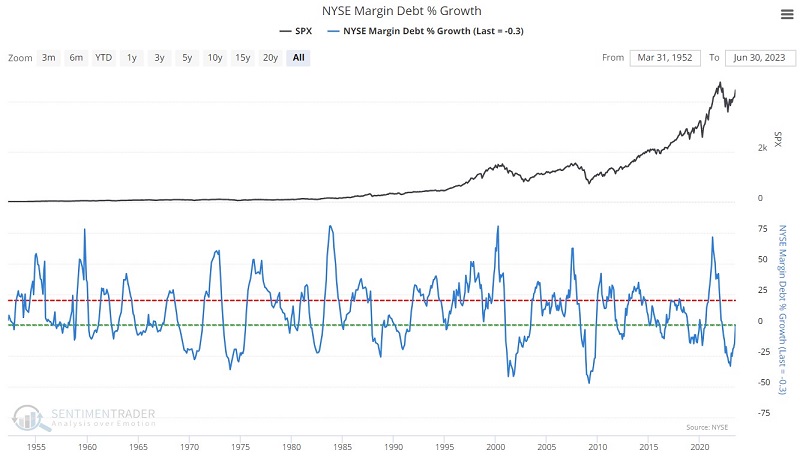
In this form, the indicator essentially serves as a sentiment indicator. As the stock market rises during a bull market, investors become more bullish and more comfortable buying stocks on margin. As a result, the indicator value typically spikes, often to an excessive level.
Conversely, as the stock market declines during a bear market, investors become more bearish and much less comfortable buying stocks on margin. As a result, the indicator value typically plummets, often to an excessive level.
In this piece, Dean correctly noted that a reversal from < -10% to > -1% has been bullish for stocks. For this article, let's take a slightly different tack.
Crosses above -19% have been bullish
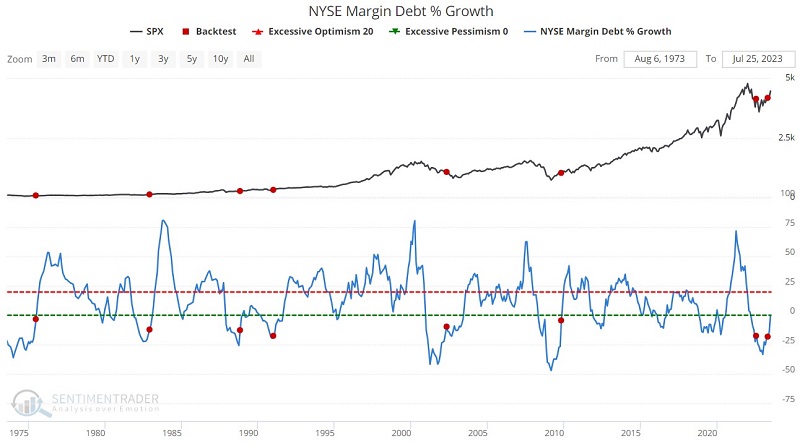
The chart below displays those times when the NYSE Margin Debt % Growth indicator crossed back above -19% after dropping below that level.
The table below displays S&P 500 Index performance following previous signals.
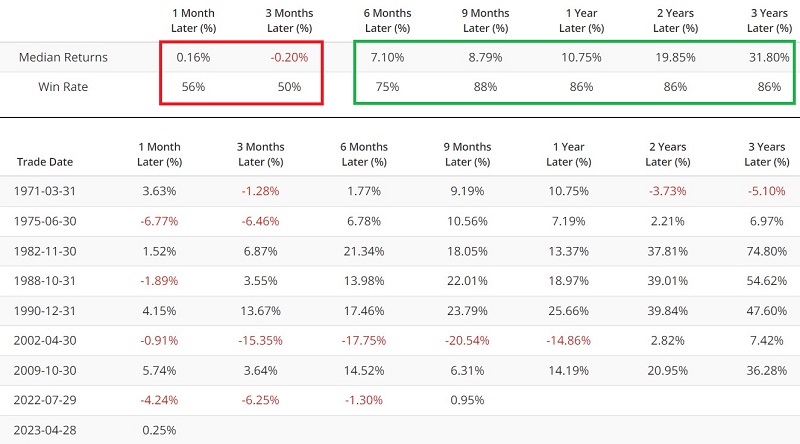
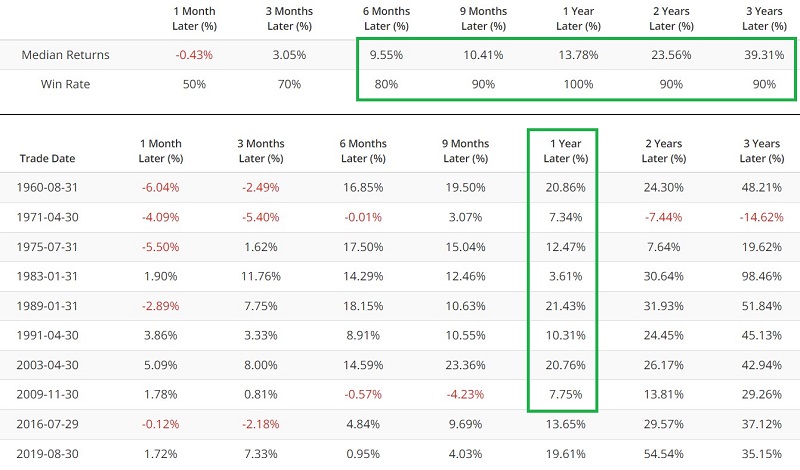
The most recent signal occurred on 2023-04-28, so we are late to the party at first blush. However, note also that 1-month and 3-month returns have essentially been a coin flip. Historically, the return between 3 months and 12 months after a signal has been positive. The latest signal argues that stock prices will be higher at the end of April 2024 (i.e., 12 months after the signal) than at the end of July 2023 (i.e., three months after the signal).
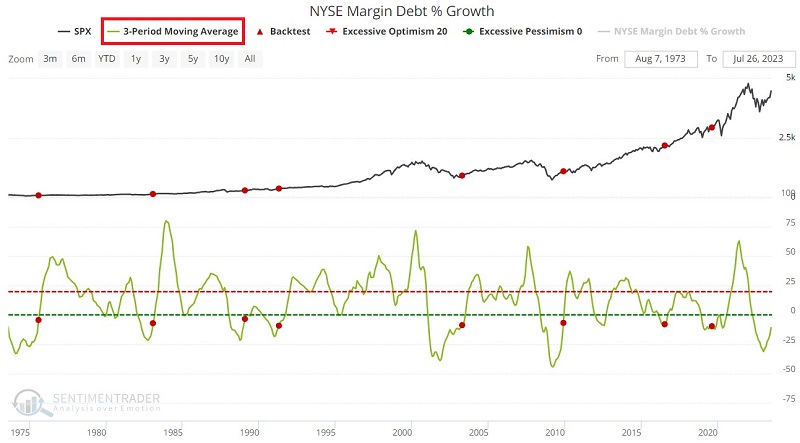
Another marker will be crossed when the 3-month moving average crosses above -10%. The chart and table below display S&P 500 action following those occasions when the 3-month moving average of the NYSE Margin Debt % Growth indicator crossed back above -10% for the first time in 12 months.
Crosses above 60% have been bearish
There is nothing like a raging bull market to bring speculators out of the woodwork. Typically when speculation begins to run too rampantly, the stock market runs out of steam.
The chart below displays those times when the NYSE Margin Debt % Growth indicator crossed above 60%.
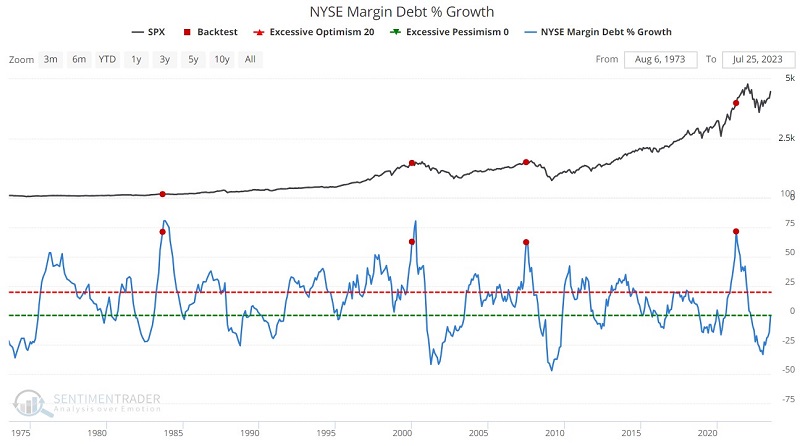
The table below displays S&P 500 Index performance following previous signals.
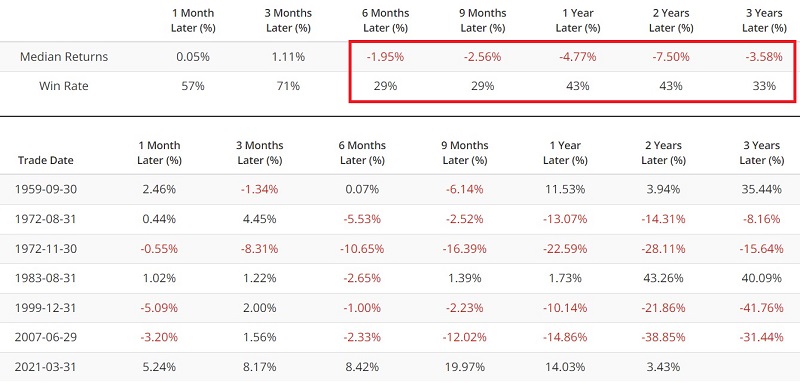
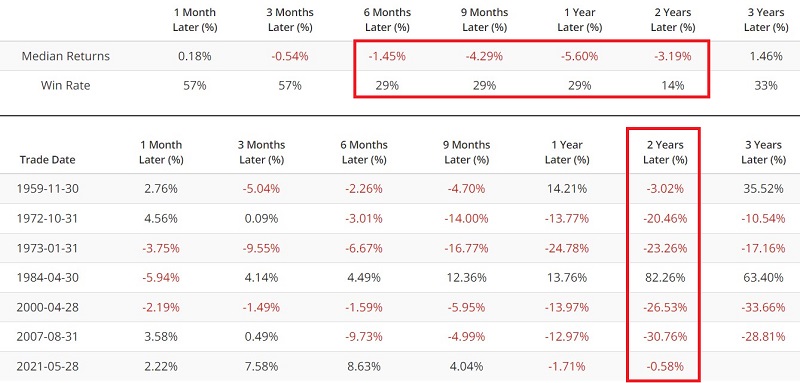
The key things to note are that the Median Returns are negative, AND the Win Rates are below 50% for all timeframes of three months or more. Very few indicators are good at forecasting a market decline over the next three-year period, but this measure has been correct four out of six times. Caution is in order when speculation gets overdone.
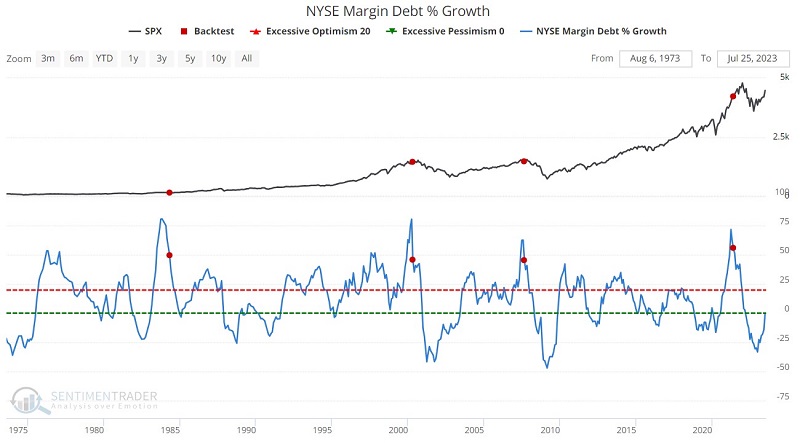
Another take is waiting for the margin debt indicator to drop below 60%. The chart and table below highlight S&P 500 performance following those signals. The most notable thing is the 14% Win Rate two years after a signal (although it should be noted that the one exception in 1984 saw the S&P soar 82% two years later).
What the research tells us…
It is important to remember that not every reading for every indicator "means something." Many indicators are primarily relevant when they reach an extreme - or reverse from an extreme. The applications detailed above should not be employed as a "trading system" because not every bull market ends with a reading above 60%, and not every bear market ends with a reading below -19%. Nevertheless, when those extremes are reached, investors will typically do well to heed the call.