
Another long-term indicator turns favorable

Key points
- Momentum can be a powerful force in the stock market
- Negative long-term momentum in the stock market typically sets the stage for the next upswing
- When S&P 500 momentum cycles from negative to positive, it typically signals a new upleg
S&P 500 Momentum cycles from negative to positive
I am not sure who first discovered this indicator. I learned of it from Mark Ungewitter (@mark_ungewitter), however, others learned the same indicator from Ned Davis Research, which they call Deviation from Trend. Also note that Dean use the same concept (with slightly different parameter values) in this recent piece on the technology sector.
For this piece I will refer to the indicator as SPX 4/40 Momentum.
The SPX 4/40 Momentum indicator uses weekly closing prices for the S&P 500 Index and is extremely simple to follow.
- A = SPX 4-week moving average
- B = SPX 40-week moving average
- C = A/B
A bullish signal occurs when:
- C drops below 0.95 and THEN subsequently crosses back above 1.03
In other words, it sets the alert when the 4-week moving average falls 5% or more below the 40-week moving average. Then it is a matter of waiting for the 4-week moving average to move back to 3% or more above the 40-week moving average (using weekly closing prices). Sometimes this happens relatively quickly; at other times, it can take years.
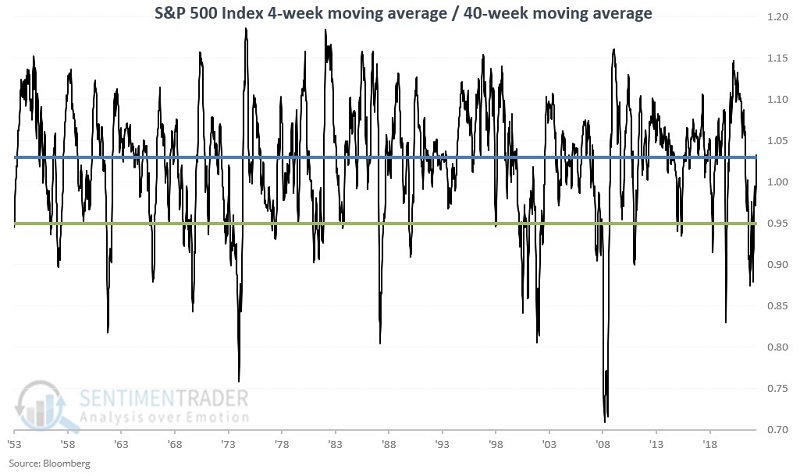
The squiggly black line in the chart below displays the 4-week/40-week ratio since 1953. The horizontal blue and green lines highlight the 1.03 and 0.95 levels. Remember, step #1 is for the black line to drop below the horizontal green line to set the alert. The actual signal occurs the next time the black line crosses back above the blue horizontal line.
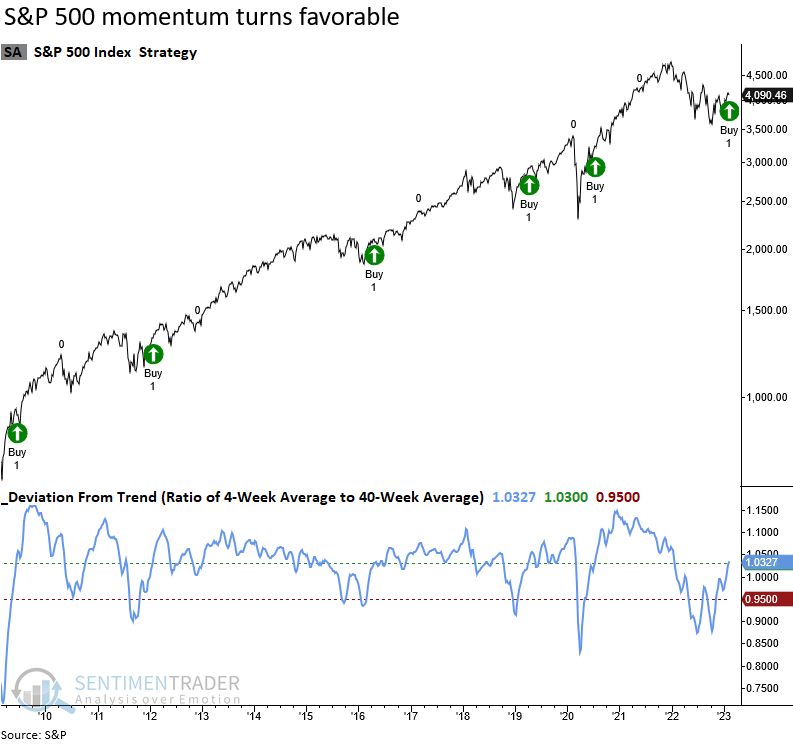
A new bullish signal occurred at the close on 2023-02-10. The chart below displays signals going back to 2009.
Historical results are compelling
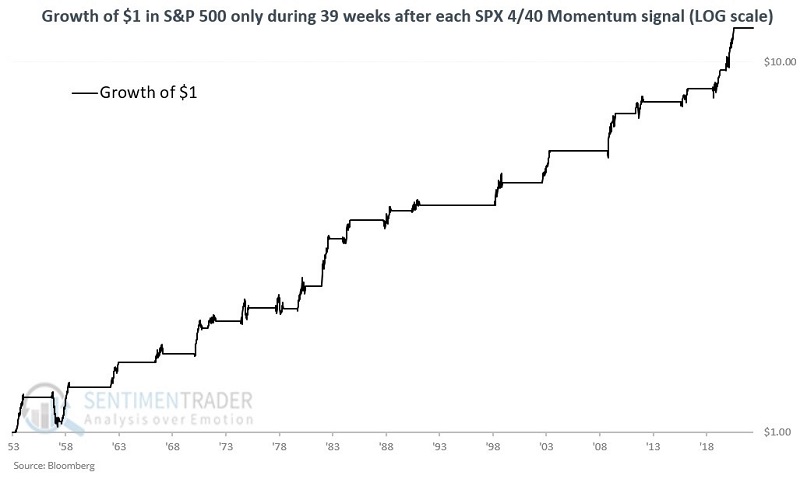
As I use this indicator, a bullish signal lasts for 39 weeks after the initial cross above 1.03. The chart below displays the growth of $1 invested in the S&P 500 Index only during the 39 weeks after each signal (displayed on a logarithmic scale).
The table below displays historical results, including the full 39-week SPX return and the worst drawdown from entry experienced during each favorable period (note that these are based on weekly closing prices, not daily data, so in some cases, the actual marked to market drawdown may be greater intraweek).
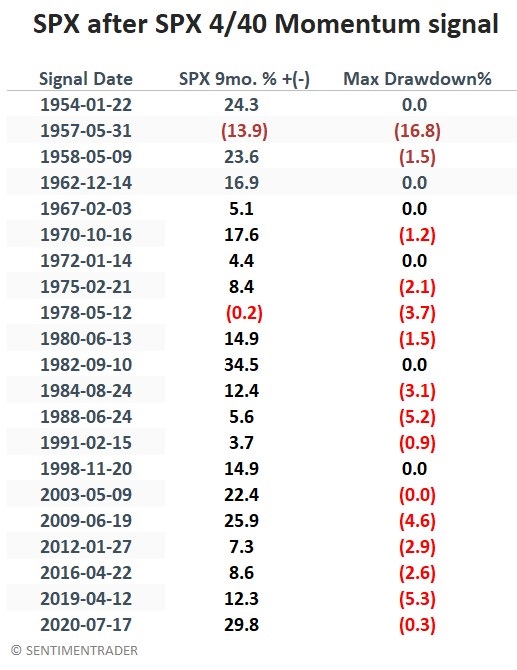
The table below displays a summary of the results.
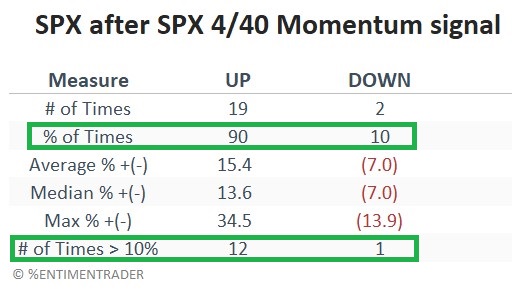
What the research tells us…
The historical results from previous SPX 4/40 Momentum signals are compelling. Does it guarantee that "all is clear" and that the market will be higher nine months from now? Not at all. No indicator or signal does that. But the latest signal that just occurred adds weight to the bullish side of the ledger.