
Another favorable factor for high-yield bonds to consider

Key points
- Dean recently posted a favorable piece regarding high-yield bonds
- The current favorable seasonal period for high-yield bonds dovetails nicely with the indicators Dean highlighted
A quick review of Dean's piece on high-yield bond breadth
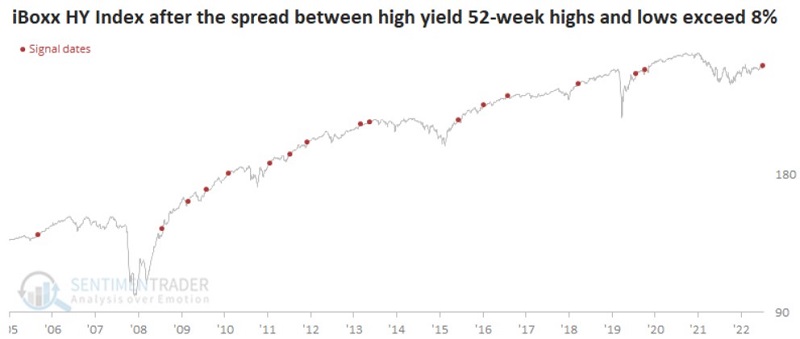
On 2023-07-07, Dean highlighted his discovery that the spread between 52-week highs and lows as a percentage of issues for high-yield bonds recently exceeded 8%. He then detailed that similar spread levels produced excellent returns for a high-yield bond index and the S&P 500
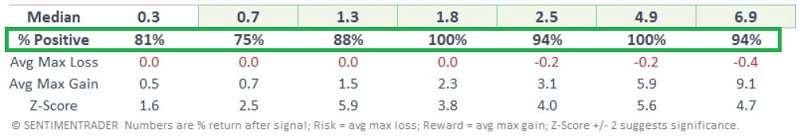
The critical thing to note in Dean's table above is the high Win Rate across all time frames. Of course, there are no sure things in the financial markets, so even consistently high Win Rates do not guarantee that "the next signal" (which occurred on 2023-06-30) will follow suit. Still, trading is a game of odds, so consistently stacking the odds in your favor gives you the best chance for long-term success. With that thought in mind, let's add another factor favorable for high-yield bonds to the mix.
Seasonality also favors high-yield bonds
The chart below displays the annual seasonal trend for the iShares iBoxx $ High Yield Corporate Bond ETF (ticker HYG). The period highlighted in the green box extends from the close on Trading Day of the Year (TDY) #124 through TDY #148.
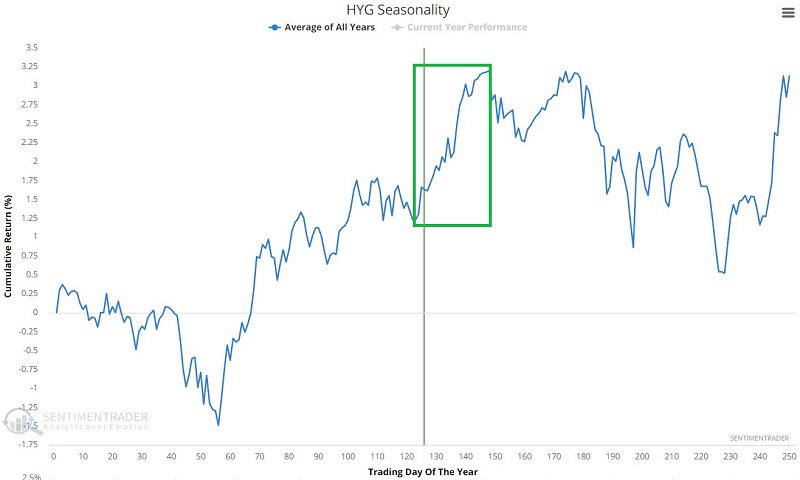
For 2023, this period extends from the close on 2023-06-29 through 2023-08-08. During this period's first five trading days, ticker HYG is down -1.2%. This suggests that we are either looking at a decent buying opportunity or in the early stages of a failed seasonal period. Only time will tell. For now, let's review the history of this seasonal period.
Using Vanguard High-Yield Fund as a proxy
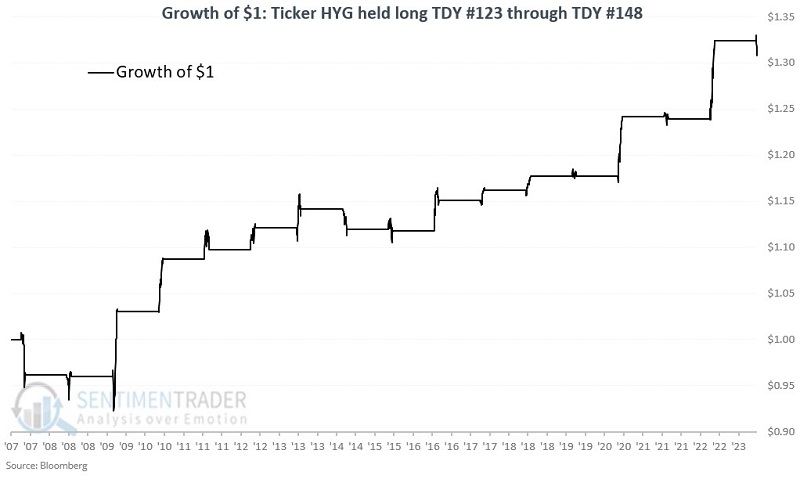
One of the largest and longest-running high-yield bond funds in the Vanguard High-Yield Corporate Fund (ticker VWEHX), which started trading in 1980. The chart below displays the growth of $1 invested in VWEHX only during the TDY #123 through TDY #148 period every year since 1980.
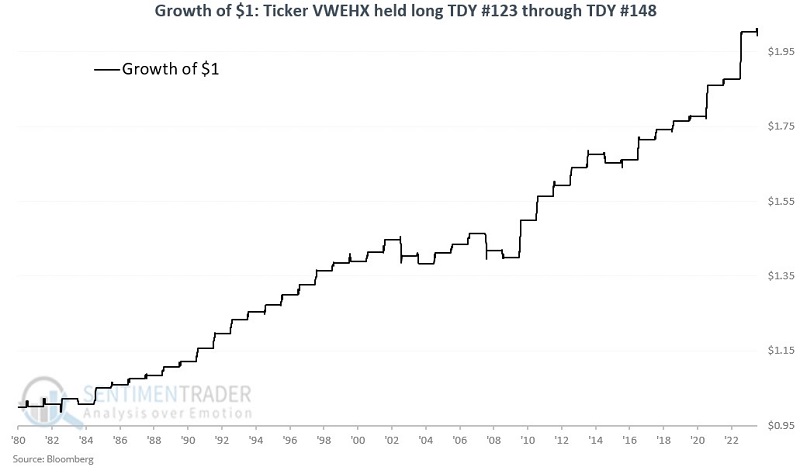
The table below summarizes VWEHX's performance during this period.
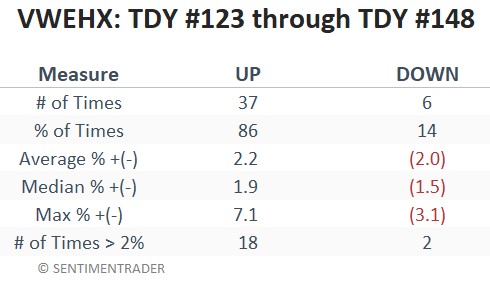
The most compelling statistic is the Win Rate of 86%. Also, note that the fund showed a gain of over +2% eighteen times and a loss of -2% or more only twice. Complicating this approach is the fact that you must open a Vanguard account to trade the fund and must wait 30 days to get back in once you sell out (per the fund's prospectus: "the fund limits an investor's purchases or exchanges into a fund account for 30 calendar days after the investor has redeemed or exchanged out of that fund account"). These limitations may compel some traders to trade an ETF such as HYG, which can be traded in a brokerage account like shares of stock.
Trading using HYG
The chart below displays the growth of $1 invested in VWEHX only during the TDY #123 through TDY #148 period every year since 2007.
The table below summarizes HYG's performance during this period.
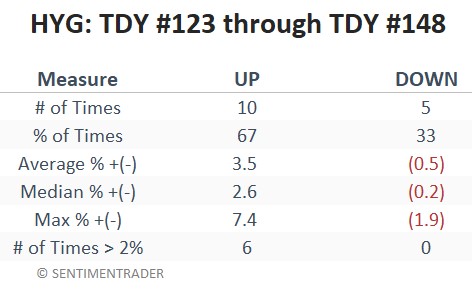
HYG results have been favorable, though not quite to the same degree as those for ticker VWEHX.
What the research tells us…
The good news is that breadth and seasonality are now favorable for high-yield bonds. Higher prices for high-yield bonds have historically followed both of these factors. The bad news is that - so far - high-yield bonds have responded to this supposedly favorable development by declining over -1% in price in just a few short days. Traders should look for one of two scenarios to unfold: Either a) "this time around" is going to be "one of those times" when things just don't work out. In that case, either a responsible stop-loss level or avoiding high-yield bonds altogether (unless and until they show signs of life) is in order, or b) high-yield bonds presently offer a buying opportunity.