
Another Composite Washout Model member triggered an alert

Key points:
- After five consecutive sessions of closing below its lower Bollinger Band, the S&P 500 staged a reversal
- Similar Bollinger Band signals preceded favorable returns and win rates for the S&P 500
- The TCTM Composite Washout Model signal count increased to 20% following the Bollinger Band alert
Selling pressure abates, triggering a Composite Washout Model member alert
A component in the TCTM Washout Model triggered a new alert after the S&P 500 closed below its lower Bollinger Band for five consecutive sessions and subsequently reversed higher, exceeding the midpoint or indicator average. In case you were wondering, I adhere to the standard indicator settings for the Bollinger Band.
While I designed the model to identify extreme selling pressure that typically occurs near significant market correction lows or bear market troughs, it occasionally triggers near a peak, as is the case now.
The previous alert from February 2022 fell into this category and turned out to be untimely, which is why it is imperative to use a weight-of-the-evidence approach.
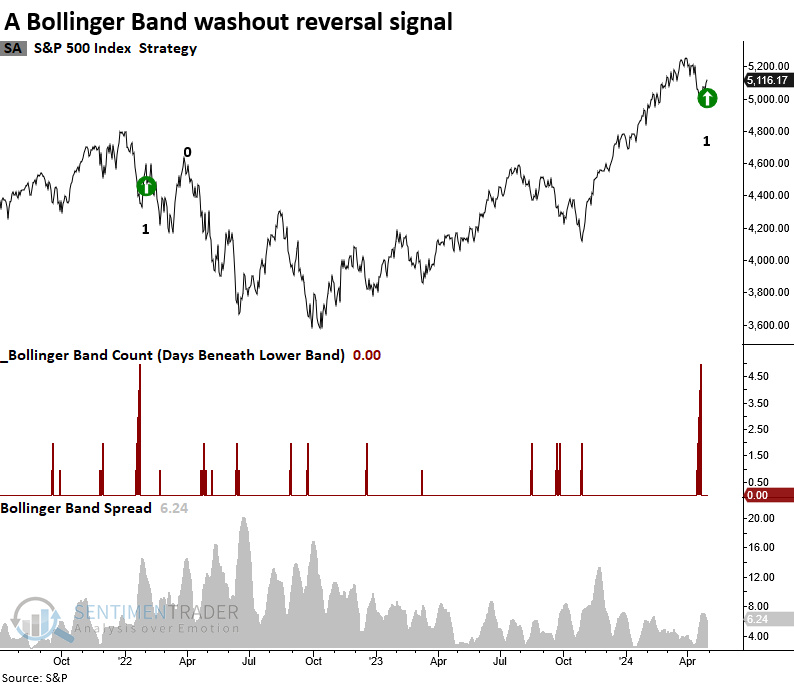
Additionally, the Bollinger Band model stipulates that the differential between the upper and lower bands remains under a user-specified threshold of 25%, ensuring that volatility hasn't surged to a detrimental level.
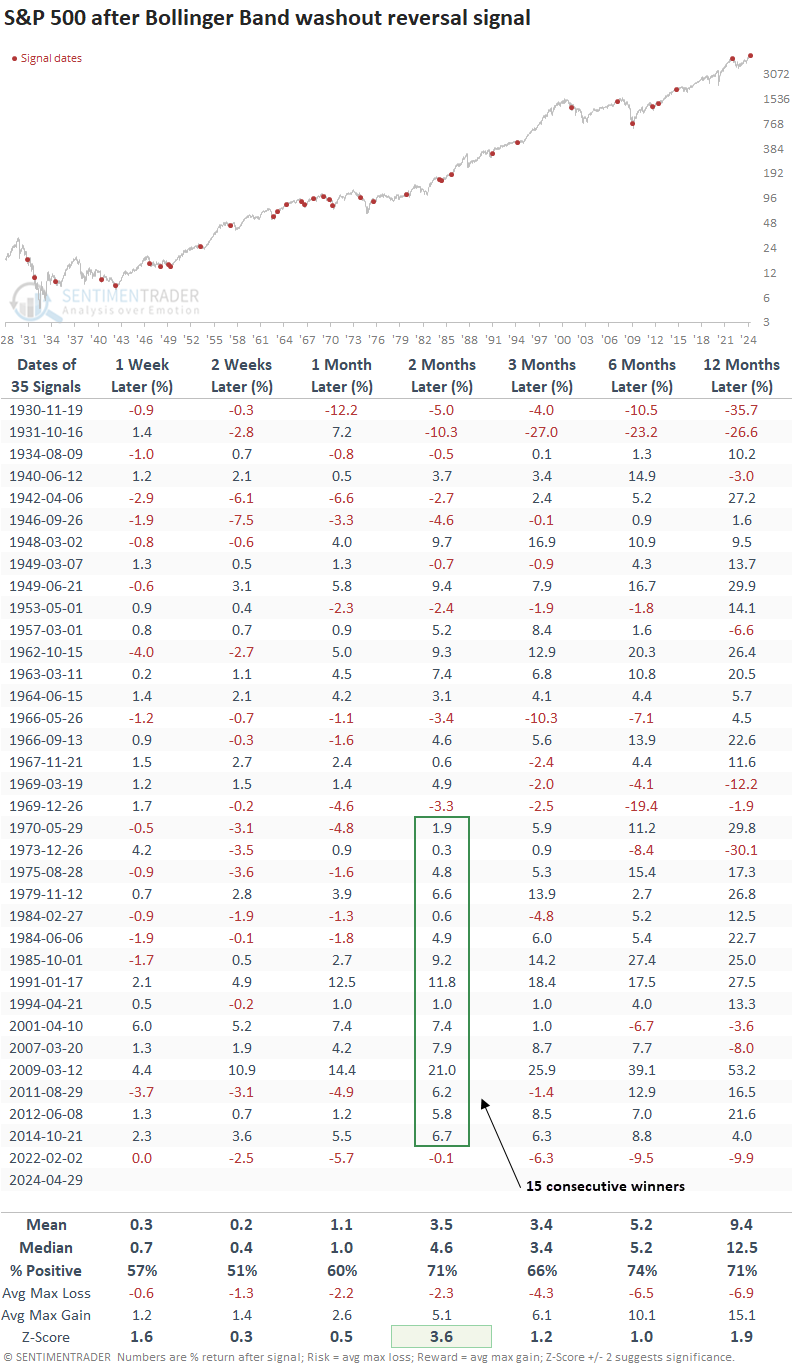
Similar Bollinger Band reversal signals preceded positive returns
The Bollinger Band model has generated a signal 35 other times since 1930. Similar alerts resulted in an upward bias in the S&P 500, especially over the following two months. This period produced a median return exhibiting significance compared to the study period and recorded a 15-signal win streak before the February 2022 whipsaw.
Additional context
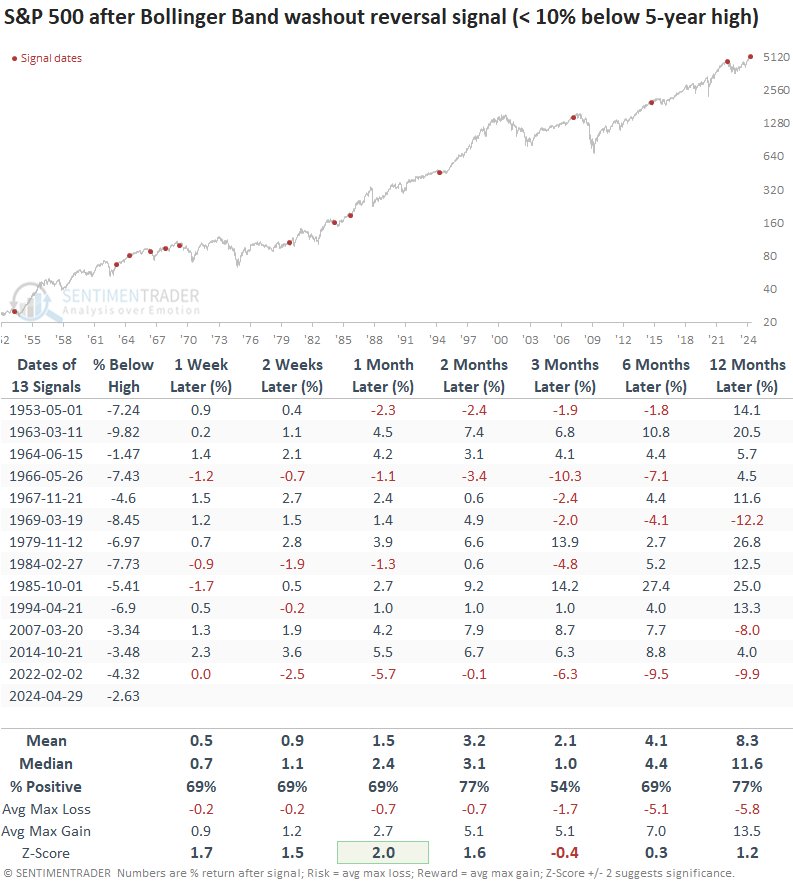
The latest signal occurred with the S&P 500 only 2.63% below its high. Suppose I isolate all precedents that occurred less than 10% below a 5-year high. In that case, win rates improve in 5 out of 7 horizons, while returns are slightly less favorable. However, this is unsurprising given the vicinity near a high, where returns are historically less robust.
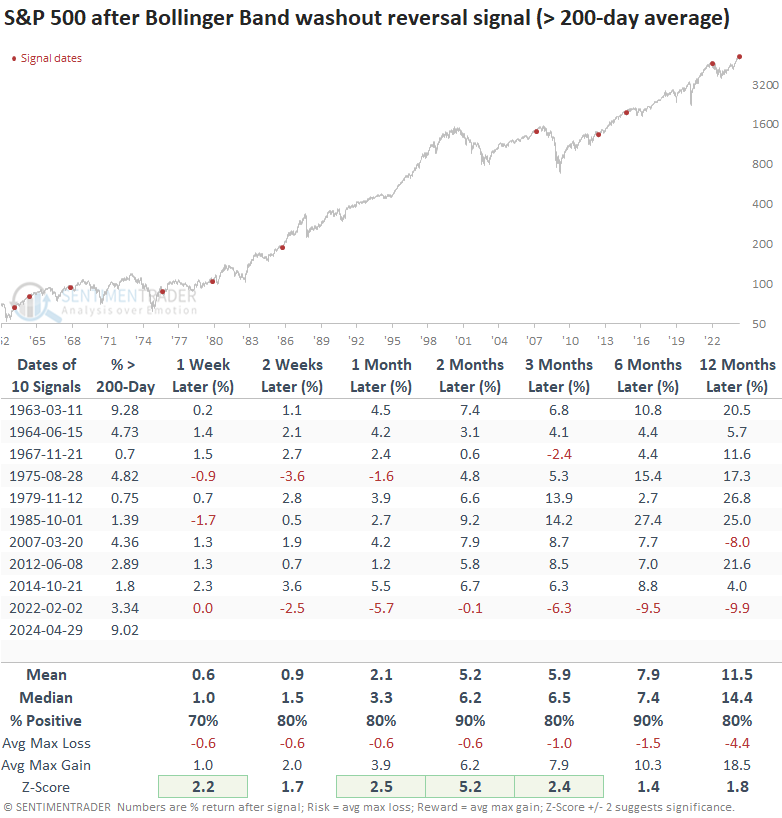
Precedents that occurred with the S&P 500 above its 200-day average, like now, produced outstanding returns and win rates, with several horizons exhibiting significance compared to the study period.
Other indexes
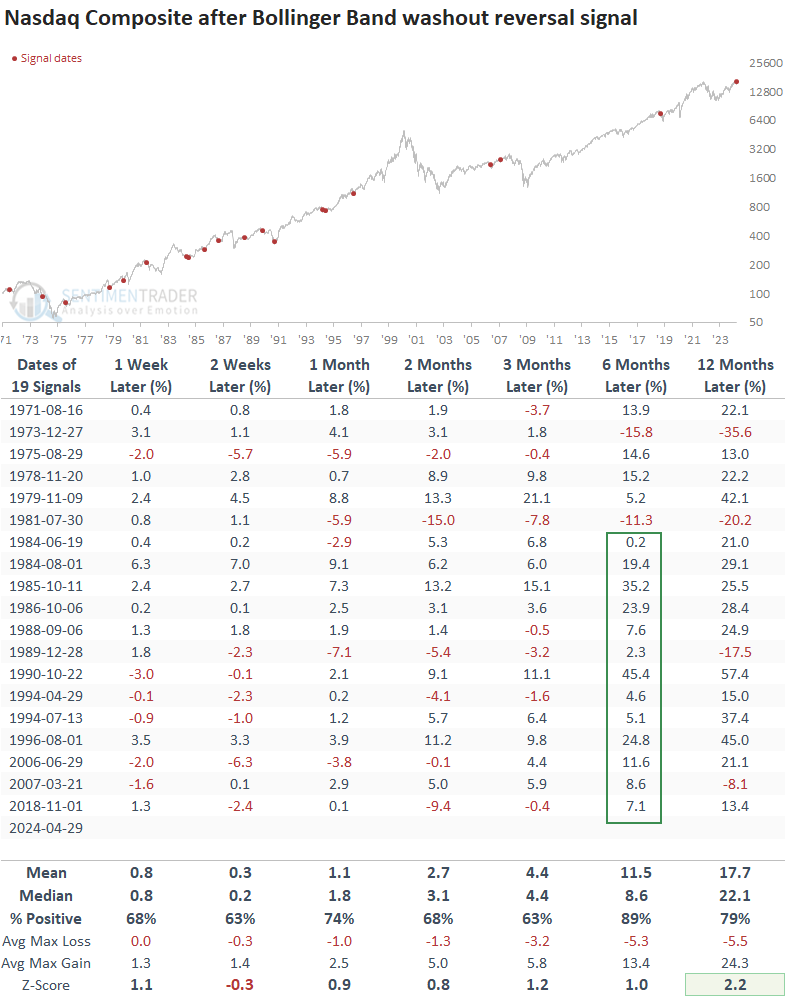
The Bollinger Band model's versatility extends beyond the S&P 500. It has proven effective across other indexes, and the Nasdaq Composite has also generated an alert.
Over the following six months, the Nasdaq Composite was higher 89% of the time, with the prior loss occurring during the 1980-82 bear market.
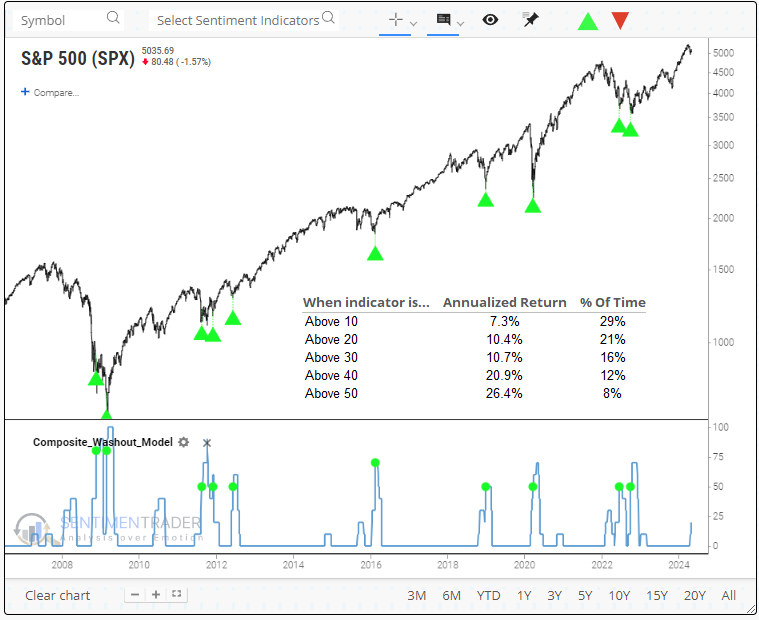
TCTM Composite Washout Model
The Composite Washout Model requires a signal count of 50% to produce an alert. However, annualized returns for the S&P 500 since 1928 show a noticeable uptick when the model exceeds 40%.
What the research tells us...
Indexes have been under pressure as investors realize that yields could remain higher for longer. Last week, the selling pressure alleviated enough to trigger a Bollinger Band washout reversal alert. This component in the Composite Washout Model triggers an alert when the S&P 500 falls below its lower Bollinger Band for five successive sessions and reverses above the indicator average. Similar precedents produced solid returns and win rates for the world's most benchmarked index, especially when trading above its 200-day average. The Nasdaq composite also generated a signal, exhibiting excellent results over the subsequent six months.