
Another clue for the U.S. dollar

Key points
- Seasonality suggests potential strength for the U.S. Dollar early in the year…
- …followed by the potential for significant weakness - which could have bullish implications for commodities in general
- A related gold indicator has recently added more weight to the "strong, then weak" argument for the dollar
One outlook for the dollar says "higher, then lower"
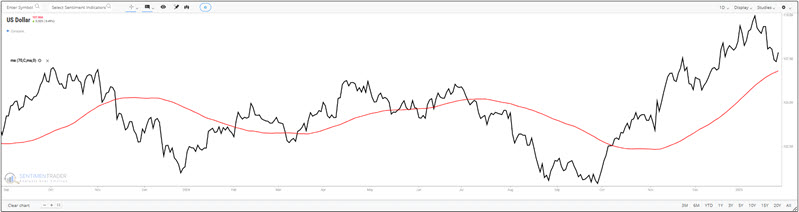
The chart below shows that despite a recent pullback, the U.S. dollar remains objectively in an uptrend.
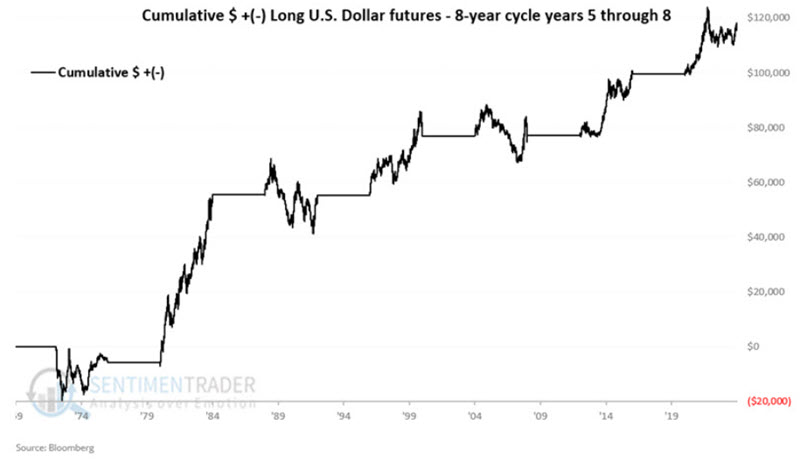
In this piece dated 2024-12-31, I highlighted several seasonal and cyclical factors related to the U.S. dollar. The article noted that January 2025 marks the start of Year #1 in a new 8-year cycle for the dollar. Historically, the first four years have witnessed significant weaknesses, and the last four years have seen strength. The charts below display cumulative $+ (-) from holding a long position in dollar futures during the first four years (first chart) versus the last four years (second chart).
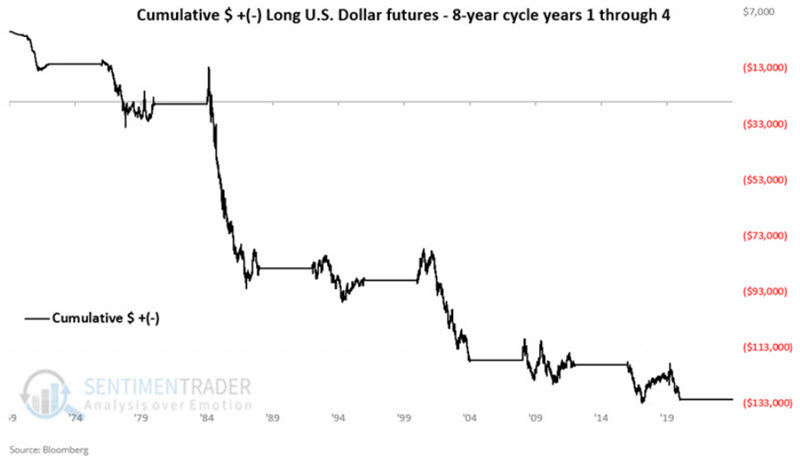
As always, seasonal/cyclical trends are not guaranteed. A supposedly "unfavorable" cyclical period does not guarantee weaker prices. More importantly, however, it can offer an important clue. That clue presently alerts us to look for a weaker dollar over the next several years.
A potential for short-term strength
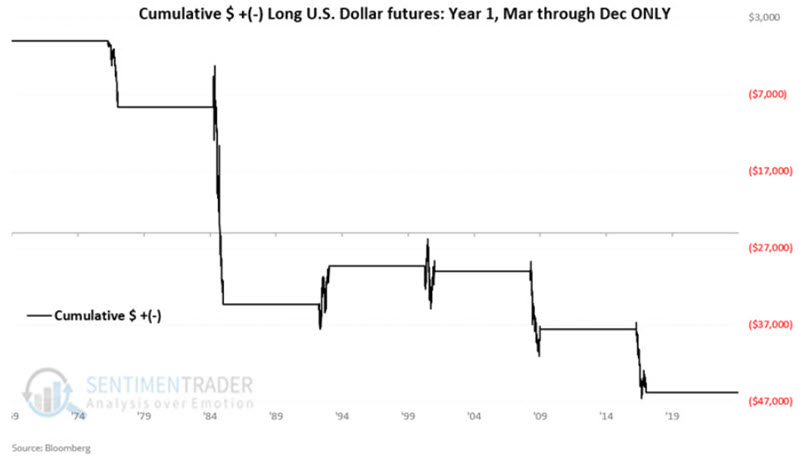
In the original piece, I noted that the dollar tended to show strength in January and February of Year 1 in previous 8-year cycles. The charts below display cumulative $ +(-) for a long position in dollar futures during January and February of Year 1 (first chart) versus March through December of Year 1 (second chart).
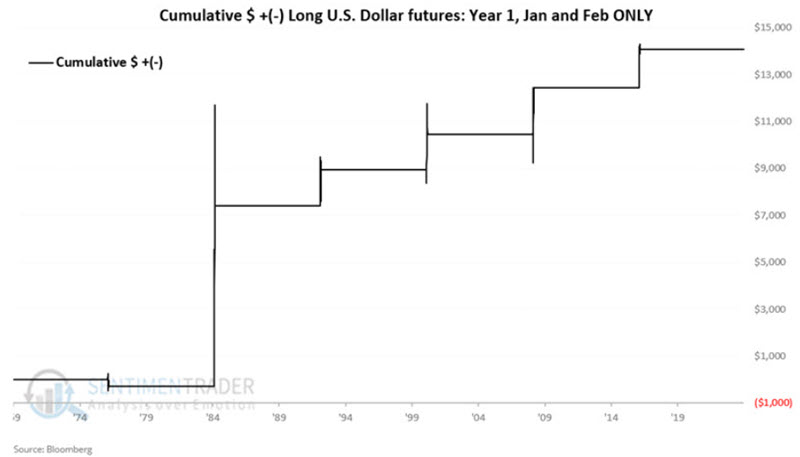
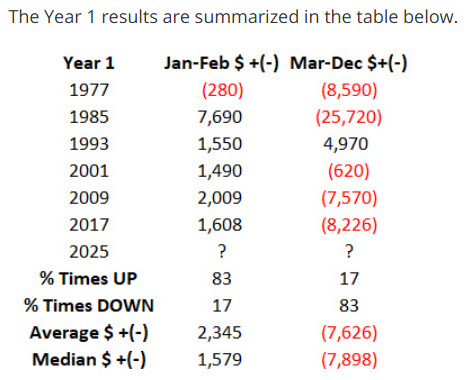
The table below clearly shows the "Jekyll/Hyde" nature of Year 1 of the 8-year cycle for the dollar.
Another warning sign flashes yellow for the dollar later in 2025
It is widely acknowledged that the U.S. dollar and gold have a slightly inverse relationship over the long run. However, over shorter periods, this relationship can vary significantly. For example, from 2019 through 2024, the two had a correlation coefficient of -0.34. However, from October through December 2024, the value was a positive 0.29. The bottom line is that indicators based on-or which may affect-gold can also offer clues for the dollar.
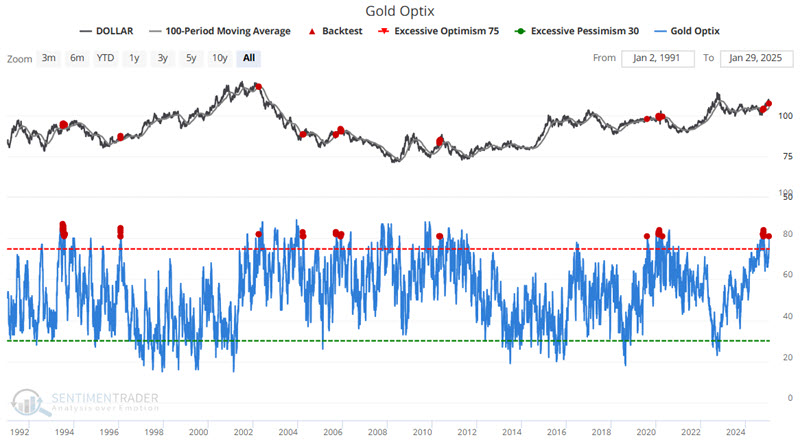
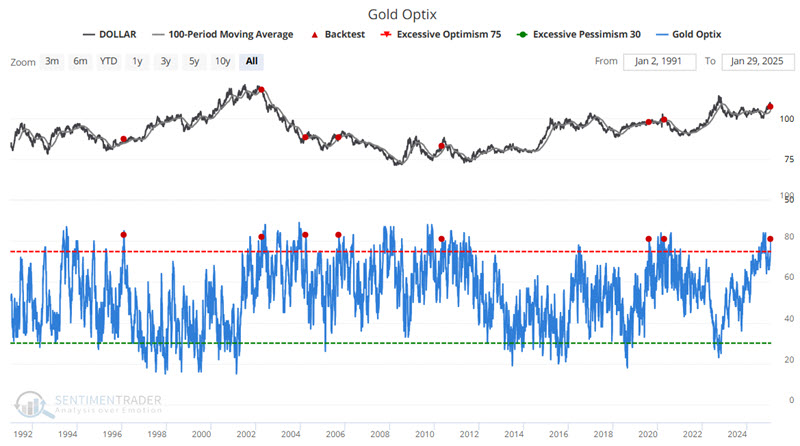
The chart below highlights all dates when our Gold Optix indicator was above 80%, and U.S. dollar futures were above their 100-day moving average.
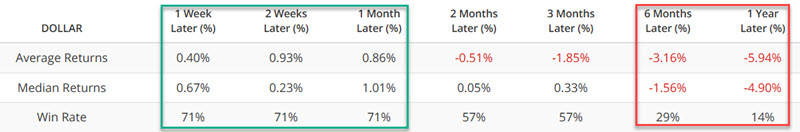
The table below summarizes dollar performance following previous signals.
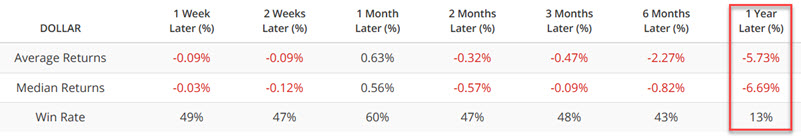
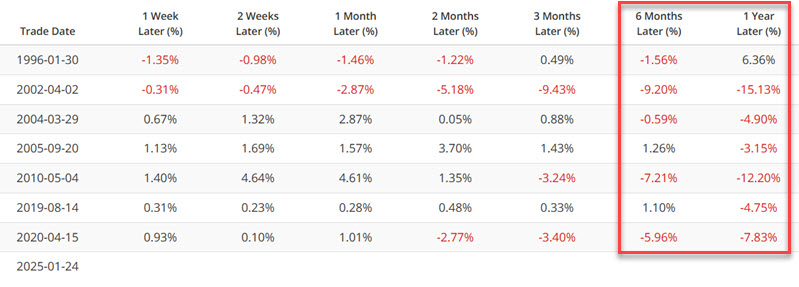
The chart below displays only signals that are the first within three months.
The tables below summarize subsequent dollar performance and show signal-by-signal results. Again, note the early strength, followed by subsequent significant weakness. The sample size is relatively small, but the implication of the historical 1 Year Win Rate of 14% is clear.
The results from this indicator dovetail nicely with the cyclical data highlighted earlier.
What the research tells us…
So, is the U.S. dollar sure to rally in the immediate future and then sell off later in the year? Not at all. As always, seasonality and individual indicators merely offer weight of the evidence clues based on historical results. That said, as long as the dollar holds in an uptrend, there is no reason to fight it. However, suppose the dollar starts to break down at any point in 2025. In that case, the evidence presented here suggests that traders treat it as an opportunity to play the short side of the U.S. dollar (and possibly the long side of commodities in general).