
Another breakout for growth over value

Key points:
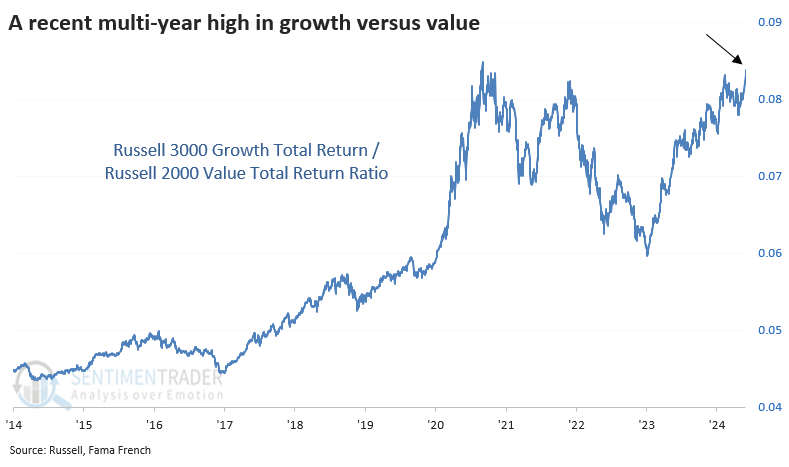
- A ratio of the total return in growth stocks versus value stocks broke out to a 3-year high last week
- It's logical to assume that breakouts should favor risk-on assets going forward
- This has not worked historically, with relatively poor returns for growth stocks and the broader market
Another growth breakout
Growth stocks enjoyed another spurt in May, to the long-suffering envy of value investors. A ratio of the total return in Russell 3000 growth stocks relative to Russell 3000 value stocks reached a new multi-year high this past week.
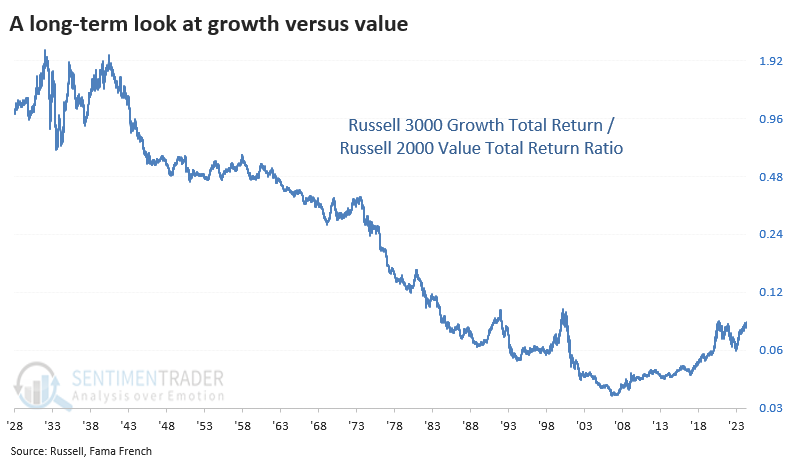
The chart above is misleading for long-term investors. The ratio between these two factors bottomed in 2006, marking the most substantial shift in nearly 100 years. Prior to the past 20 years, growth stocks had consistently underperformed value over longer periods.
It would be reasonable to assume that a fresh breakout in growth versus value signifies an appetite for risk among investors. An appetite for risk means they're more likely to buy, which means they're more likely to push stocks higher.
But assuming anything logical when humans are involved is fraught with risk, and this is no different.
Poor returns
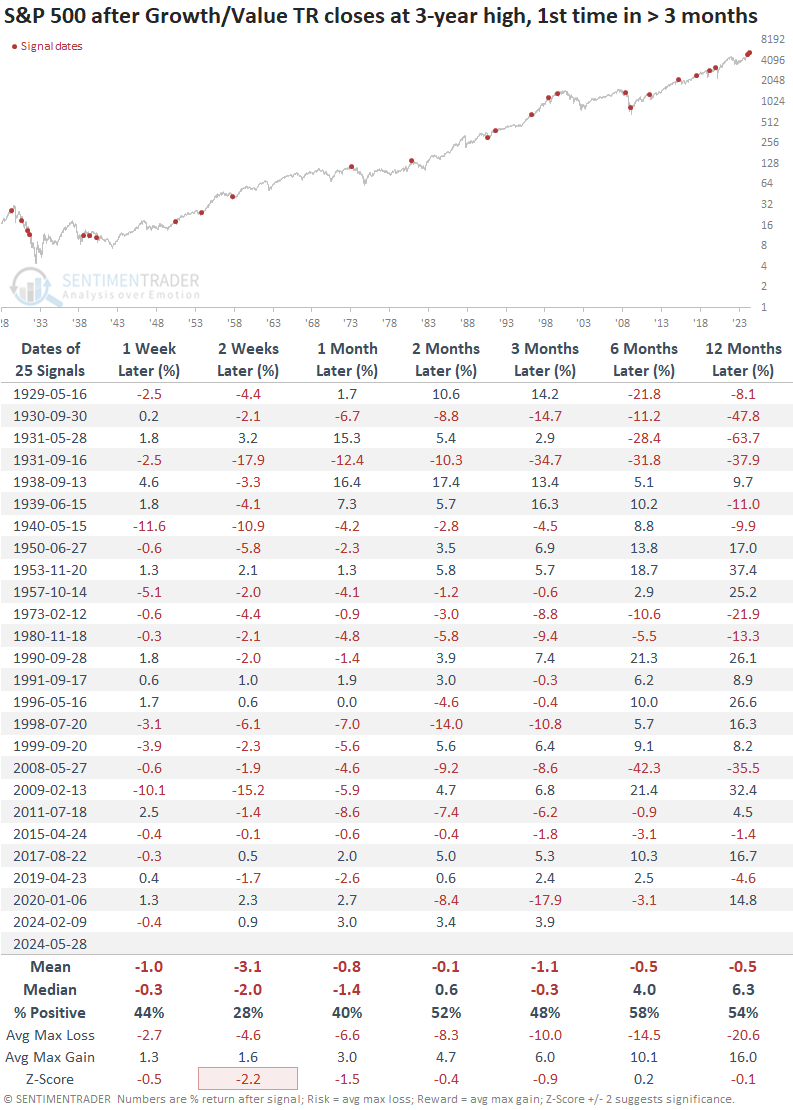
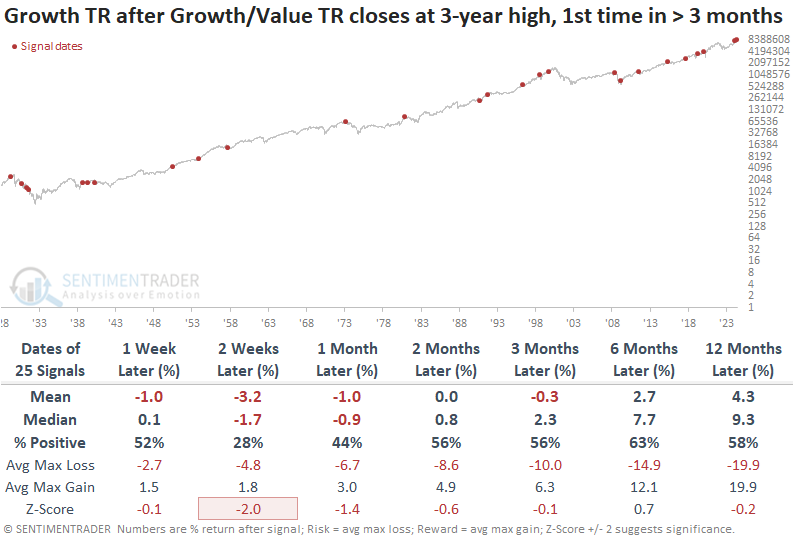
The table below shows other times when the ratio in total return of growth versus value notched a multi-year high for the first time in at least several months.
These were not good buy signals for the S&P 500. Over the next couple of weeks, the S&P rallied only 28% of the time, a shockingly poor performance. Even up to a year later, the index suffered a negative mean return (mostly thanks to disastrous signals in the 1930s). Even the median return was well below random, and the risk/reward skew was atrocious.
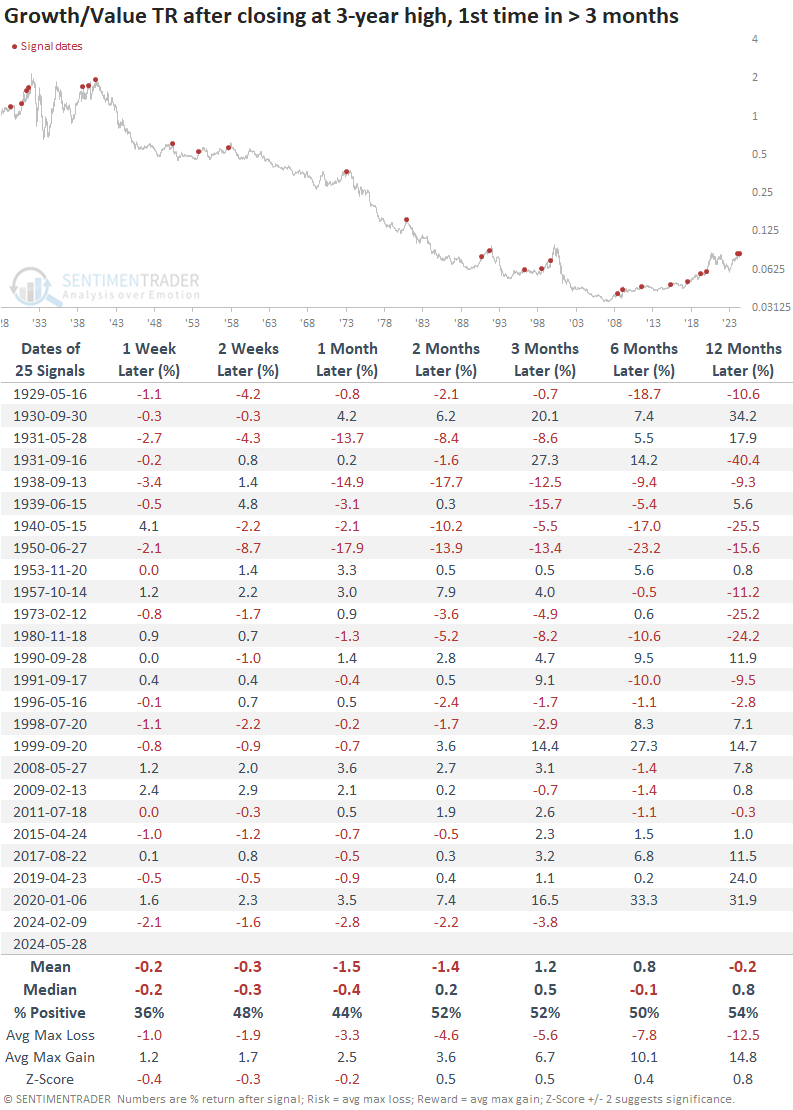
The problem is that these breakouts tended to fail. We can see below that the ratio of growth to value tended to recede after these new highs, which was a headwind for further gains in the broader market.
If we want to focus on the past 20 years - hey, maybe things have changed permanently - then short-term results were still poor. After the first month or so, growth resumed its outperformance most of the time (again, only over the past 20 years).
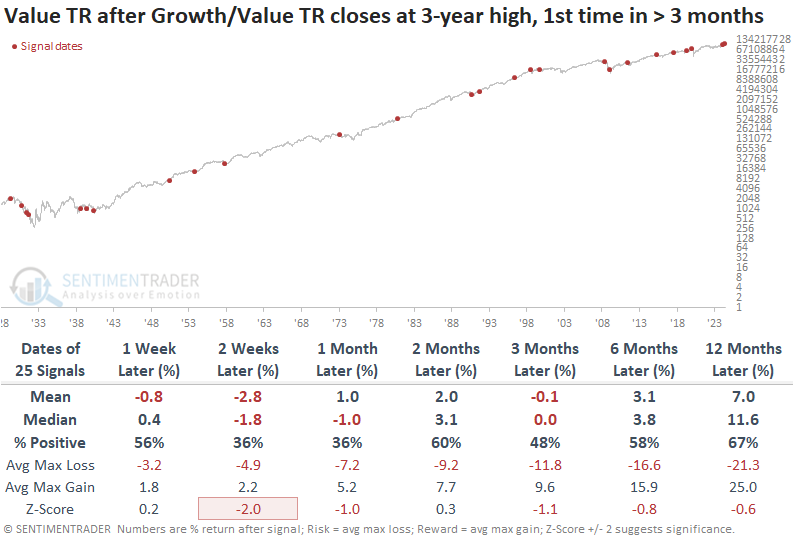
The summary tables below show the total return in each factor after these signals. We can see how poorly growth stocks did in the short term, but even over longer time frames, there wasn't much to be excited about.
Value stocks tended to hold up better, but that's a relative victory. Absolute returns in these stocks weren't all that great, and risk was still too high compared to reward to consider this any kind of compelling argument for value stocks.
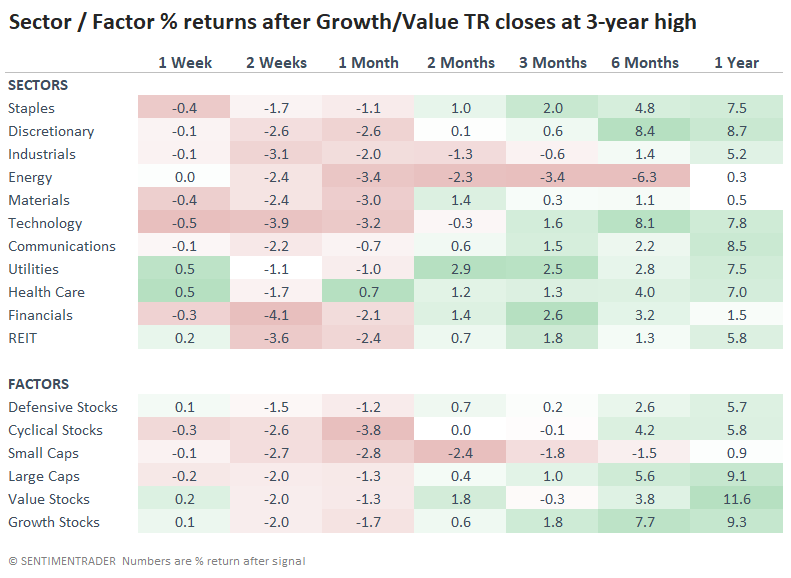
Among other sectors and factors, small caps and energy stocks tended to take it on the chin more than others, with industrials and cyclical stocks also dragging along near the bottom. Defensive sectors like staples and utilities were relatively solid.
What the research tells us...
There have been more concerning developments triggering in the past couple of weeks than we've seen since October 2022. Most of what we've discussed in that roughly year and a half suggested a higher likelihood of solid stock performance. That has started to change, with warnings popping up in various parts, especially regarding "riskier" areas like growth and technology.
The latest growth-over-value breakout can be added to that list. Even if we're in a permanent new regime of growth stocks outperforming value, the trend has tended to take a multi-week breather after fresh breakouts like we saw last week.