
...and three for the bears

Key points
- The trend of most stock market indexes has been and remains favorable, but it is essential to keep one's eye on the horizon for signs of potential impending trouble
- In Part I, we highlighted several indicators that have recently flashed bullish continuation signals
- Here in Part II, we highlight some signs that suggest that things could, at the least, get a bit choppier
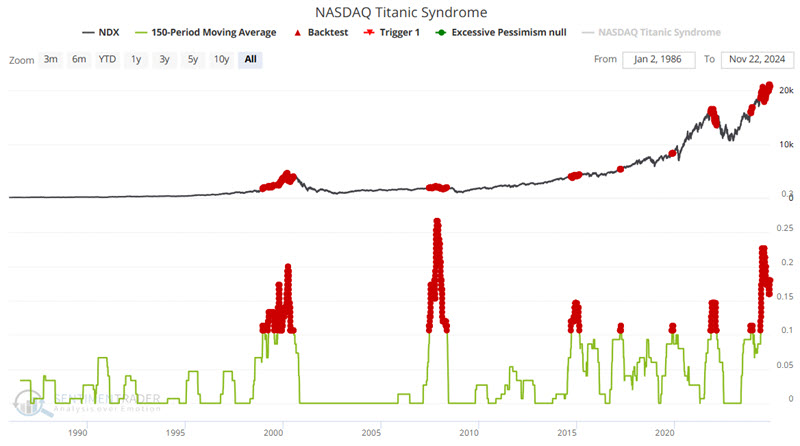
The Nasdaq Titanic Syndrome is flashing yellow
Bill Omaha created the Titanic Syndrome in the 1960s. It highlights a technical market condition when stocks have recently been at a high, and then there is a sudden jump in new 52-week lows versus highs on the Nasdaq. For our purposes, we use the following conditions: 1) The Nasdaq 100 closed at a 52-week high at some point in the past seven sessions, and 2) New 52-week lows outnumber 52-week highs on the Nasdaq. It is a warning sign that typically precedes trouble over the next 12 months. However, market performance leading up to trouble often varies widely from incident to incident.
In the tests below, we use a 150-day moving average of the Nasdaq Titanic Syndrome indicator as an alert to potentially troubling conditions in the longer term. Specifically, we are looking for days when the 150-day moving average is above 0.10. Let's be explicitly clear about what that alert says and does not say:
- This alert does not say "sell everything" or even "sell now," for that matter
- This alert does say, "There is likely to be some trouble sometime in the next twelve months, and that trouble could include a significant market decline - or at least a larger correction than we've seen in some time - so be prepared to act if price action shows signs of breaking down."
The chart below highlights with a red dot each day when the 150-day moving average for the Nasdaq Titanic Syndrome indicator was 0.10 or higher.
The table below summarizes the subsequent Nasdaq 100 performance.
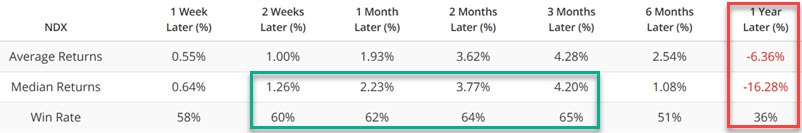
The table above shows a tendency for the Nasdaq to continue higher for several months. However, average median one-year returns have been negative. This alerts investors of the potential need to play some defense when the current trend ultimately cools off and reverses.
It should be noted that this signal has been flashing yellow since late May and that the stock market has nevertheless worked its way steadily higher over the past six months. This signal's history suggests the potential for a meaningful market correction in the next six months.
Small speculators continue to bet more and more heavily on the bullish side
Our Small Spec Index Position indicator shows the net position of small (nonreportable) traders in S&P 500, Nasdaq 100, and DJIA index futures, full contract, and e-mini, adjusted for position size and index value, shown in billions of dollars.
The current status of this indicator speaks for itself as the numbers continue to soar higher. Small speculators (typically the group that is most wrong at turning points) are betting more heavily than ever on a continued bull market. Interestingly, they have tended to be right in the past-but only for a while. And then things typically turned decidedly south.
The chart below displays when the indicator value was above 29.
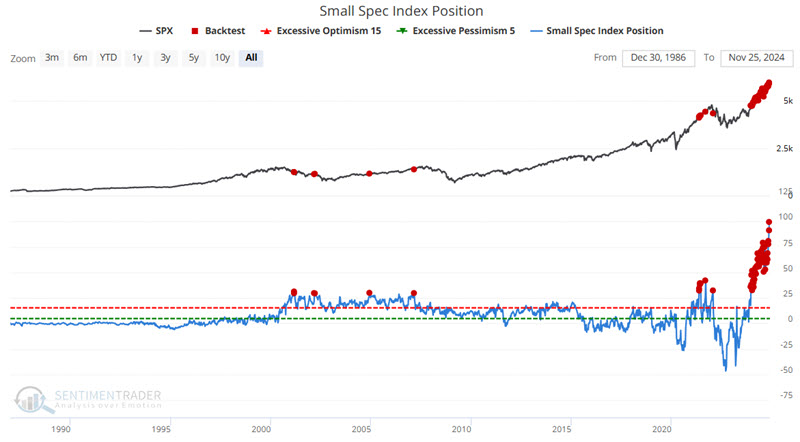
The latest cluster of heavy small spec buying is unprecedented. Intuitively, it is easy to assume that this must be highly bearish for stocks in the future. But remember that no one indicator serves as a crystal ball. The warning sign that this indicator appears to be presently flashing is just one more piece of evidence on the unfavorable side of the weight of the evidence ledger.
The table summarizes the subsequent S&P 500 performance.
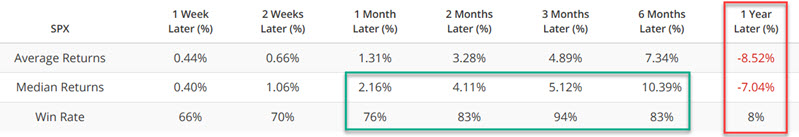
These results are pretty interesting. Three months following a signal, median returns and Win Rates are solid. The two- and three-month periods show Win Rates of 83% and 94%, respectively (note that the average Win Rates for 2- and 3-month periods for all dates are 67% and 70%, respectively). So, the current status is not a "sell everything" signal. But then 1 Year returns have been decidedly unfavorable, with just an 8% Win Rate and a median return of -7.04% (note that during the test period, the average of all dates is a Win Rate of 80% and a median return of 12.17%). So, these are highly subpar results.
For the record, this signal has been unfavorable since December 2023, and the stock market has roared roughly 25% higher. So maybe this time, the signal is just plain wrong. Still, wild-eyed buying by the typical wrong-way Corrigans of the stock market has rarely been a positive signal. This indicator's current (and ongoing) status clearly suggests that investors NOT through caution to the wind and remain vigilant in risk management.
The Nasdaq HiLo Logic Index has also issued warning signs
The HiLo Logic Index was created by Norman Fosback in 1979. Intended as a way to observe "split" market conditions, it looks for times when there are both a large number of 52-week highs AND 52-week lows among securities on the exchange. When there are a lot of both, the market is severely split between winners and losers, and it tends to be negative for stocks. When there is a very low number, the market is heavily one-sided, which tends to be a positive for stocks. The indicator is traditionally interpreted over a longer time frame, so we suggest viewing it with a 10-day moving average.
The chart below highlights those dates when the 10-day moving average of the indicator crossed above 2.5.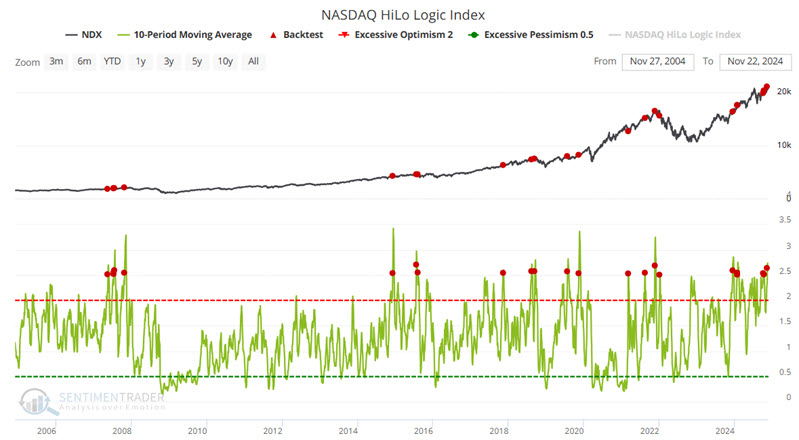
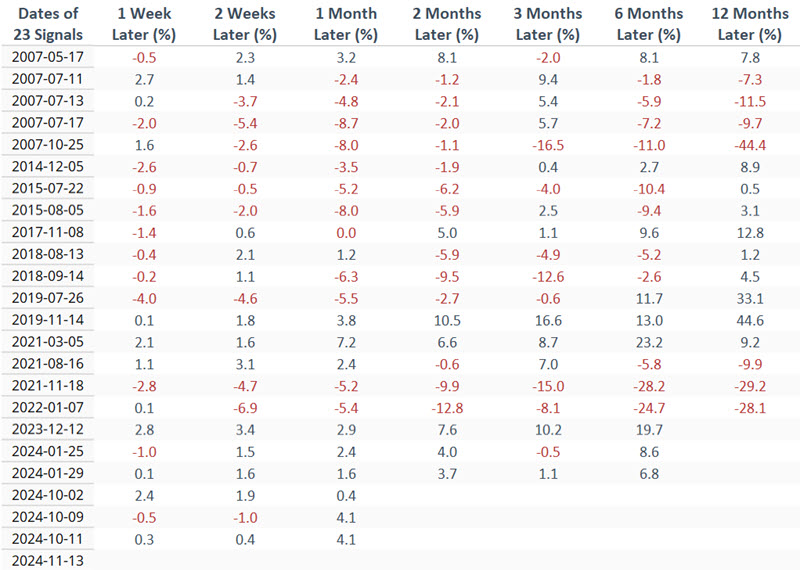
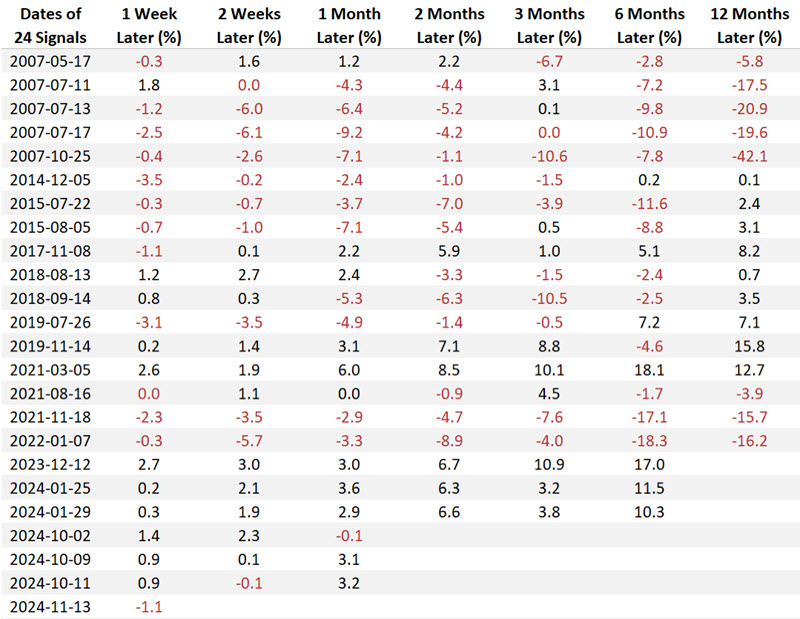
The table below displays subsequent Nasdaq 100 performance on a signal-by-signal basis. The most recent signal occurred on 2024-11-13.
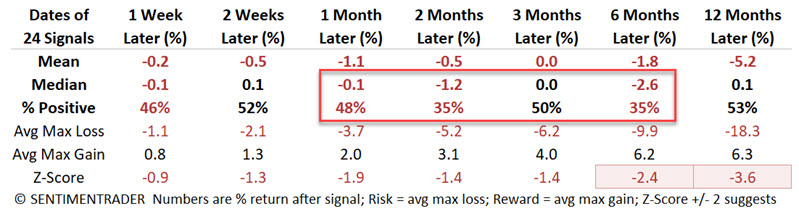
The table below summarizes Nasdaq 100 performance following all signals.
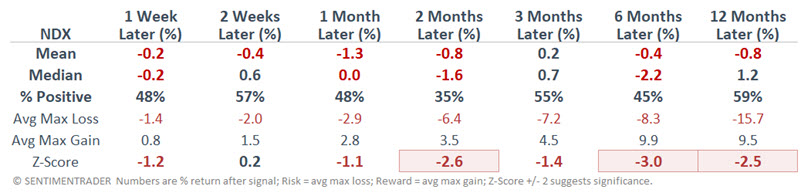
Results suggest more of a "warning of potential trouble" than an outright "sell signal." The table below summarizes Nasdaq 100 performance following all signals. The critical thing to note is the tendency for subpar median returns and win rates (% Positive).
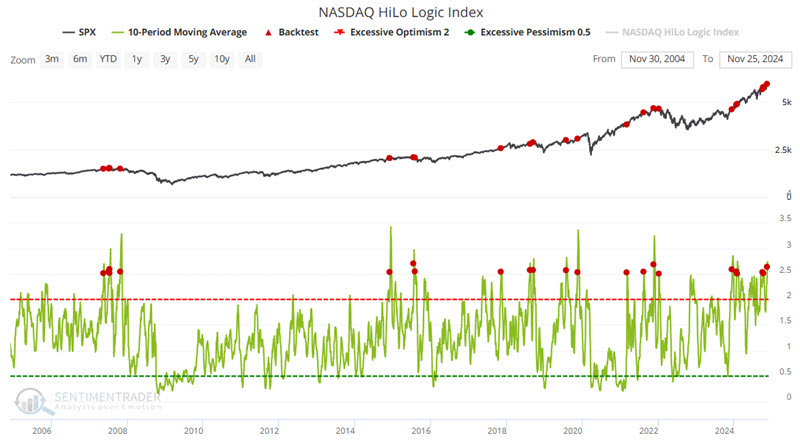
Let's also consider the S&P 500's performance. The chart below highlights the dates when the indicator's 10-day moving average crossed above 2.5. The most recent signal occurred on 2024-11-20.
The table below displays subsequent S&P 500 performance on a signal-by-signal basis.
The table below summarizes the S&P 500's performance following all signals. The key point is the tendency for subpar median returns and win rates (% Positive).
Overall, historical results are decidedly mixed. However, the key point is that results are notably subpar across all time frames for both the S&P 500 and Nasdaq 100 indexes.
What the research tells us…
Given the strength and consistency of the stock market in recent years - combined with the fact that the indicator signals detailed above have been flashing yellow for a while - it might be easy to conclude that these signals are just destined to fail this time around. And that is possible. Nevertheless, ignoring potential warning signs in the market is also dangerous. While the weight of the evidence still favors the favorable side of the ledger, it should not be surprising if the market turns much choppier in the year ahead and for gains to be a bit harder to come by.