
And the favorable indicator signal beat goes on

Key points
- Favorable indicator signals should be considered "weight of the evidence, " not automatic buy signals. Still, when a sizeable number of indicators generate favorable signals within a short time frame, it often signifies a buying opportunity for stocks
- The number of favorable indicator signals continues to pile up on the favorable side of the ledger
- This does not guarantee that the bottom is in or that the market cannot decline sharply while forming a bottom, but it does suggest a strong potential for higher stock prices six to twelve months from now
A sharp spike and reversal in the % of industries in a bear market
The Industry % Indexes in Bear Market indicator shows the percentage of 23 industries that are trading more than 20% below their 52-week highs. The chart below highlights all dates when this indicator crossed above 10%.
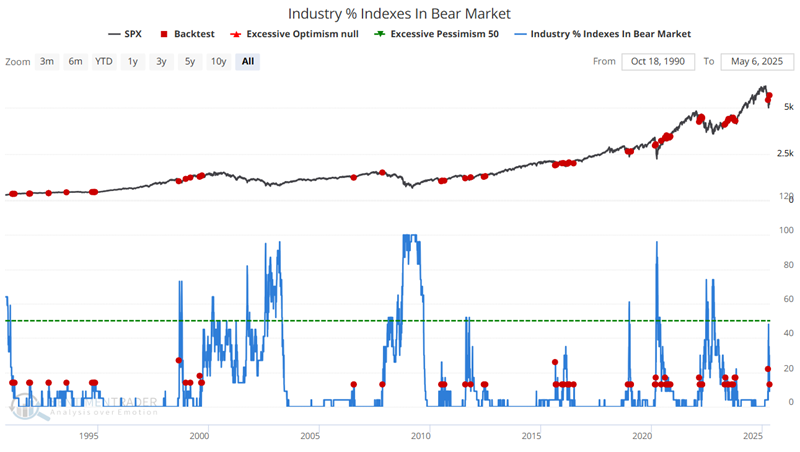
On some occasions, this event was followed by a deeper bear market (notably in2007-2008 and 2022). However, history has shown that this often highlights decent buying opportunities within a shorter-term pullback.
The table below summarizes S&P 500 performance following all the dates highlighted in the chart above.
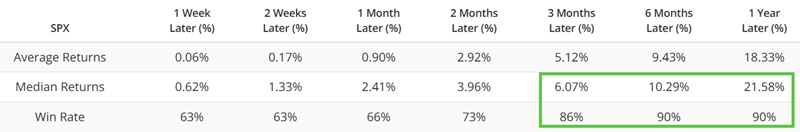
Note the exceptionally high Win Rates for six, nine months, and one year after a signal.
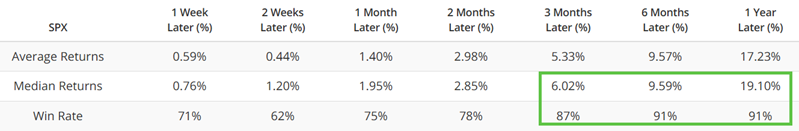
Next, we will refine the test to only look at the first time the indicator crosses above 10% for the first time in the past three months. This eliminates some of the overlapping signals in the test above.
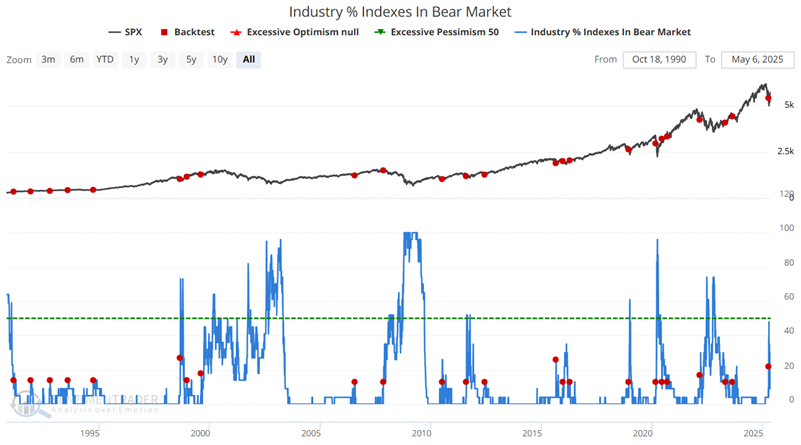
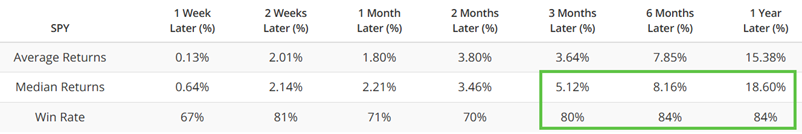
The table below summarizes the results. Once again, we see high Win Rates and above-average Median Returns from three months to one year.
The table below displays the signal-by-signal results.
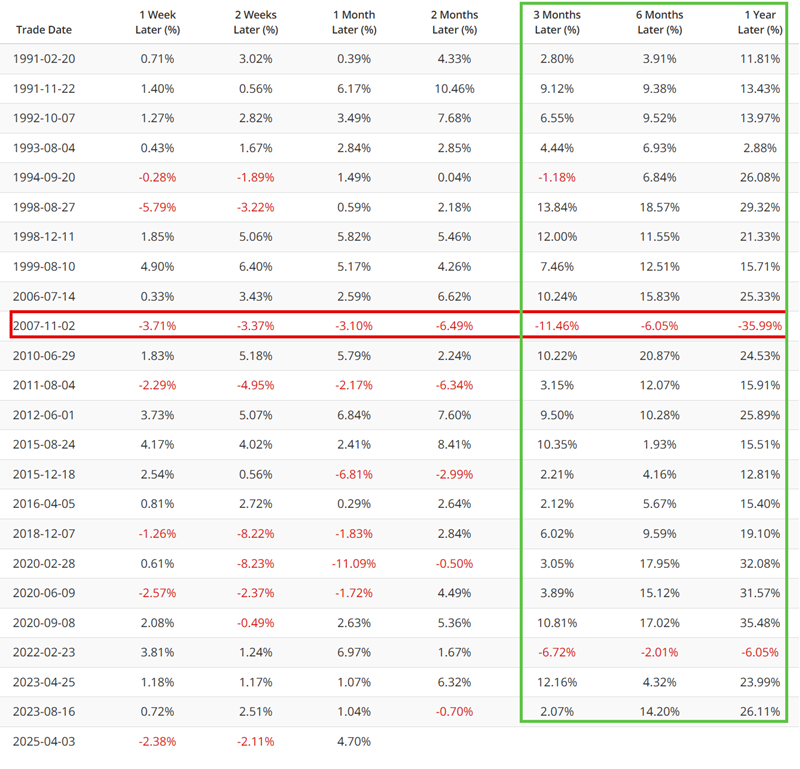
The good news is that 20 of the 23 signals saw the S&P 500 rise by at least 10% in the next year (11 of those 20 were greater than 20%, and 16 of the 20 were greater than 15%). Still, it must be noted that if this signal were used as an automatic buy signal generator (not recommended), barring a stop-loss mechanism of some sort, the 2007-11-02 signal would have resulted in a massive -35.99% decline one year later.
% of S&P 1500 stocks with low RSI readings spiked again
The % S&P 1500 RSI 14-day < 30 indicator notes the number of S&P 1500 constituents with a 14-day RSI value below 30% on any trading day. Large values tend to highlight oversold situations for the broader market.
The chart below highlights all dates when the 20-day moving average for this indicator crossed below 10%. Using a longer moving average and waiting for the value to rise above 10% and then cross back below that level is done to create something of an "all clear" signal, i.e., waiting for the extreme situation to pass before generating a signal.
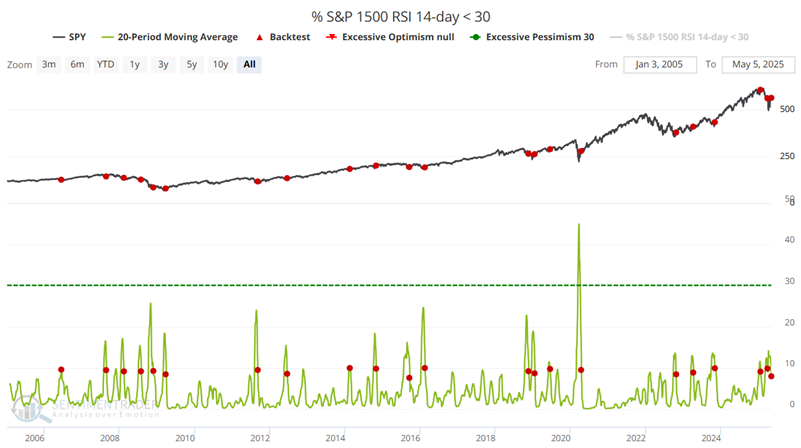
Once again, a close examination of the signals in the chart above reveals several "early" signals. This is to be expected when dealing with any single indicator/indicator signal. And once again, this is why we typically use indicator signals as weight of the evidence and not as standalone trading signals.
The table below summarizes subsequent S&P 500 performance. We once again see good reliability three to twelve months after a signal.
The table below displays results on a signal-by-signal basis. Deep losses followed the 2007-08 signals. Every signal from late 2008 through 2023 showed a gain six and twelve months later. The signals in 2025 so far are underwater. The most recent new signal occurred on 2025-05-05. So, are the 2025 signals doomed to end up like those in late 2007 and early 2008? We cannot predict. However, given the wealth of other indicator signals we have noted recently, we are giving the market the benefit of the doubt.
What the research tells us…
As always, no indicator signal or group of indicator signals guarantees a subsequent stock market advance. History is clear about the proper way to play. That said, investors are never relieved of their responsibility to allocate capital responsibly and to manage risk ruthlessly.