
And still some positives for longer-term investors

Key points
- Breadth and seasonality warnings continue to appear for stocks, pointing to potential trouble in the months ahead
- Still, several other signals suggest that long-term investors continue to avoid any urge to panic
- Our Aggregate Signal Model and the Micro Cap / S&P 500 Relative Ratio Rank indicators have recently flashed continuation signals
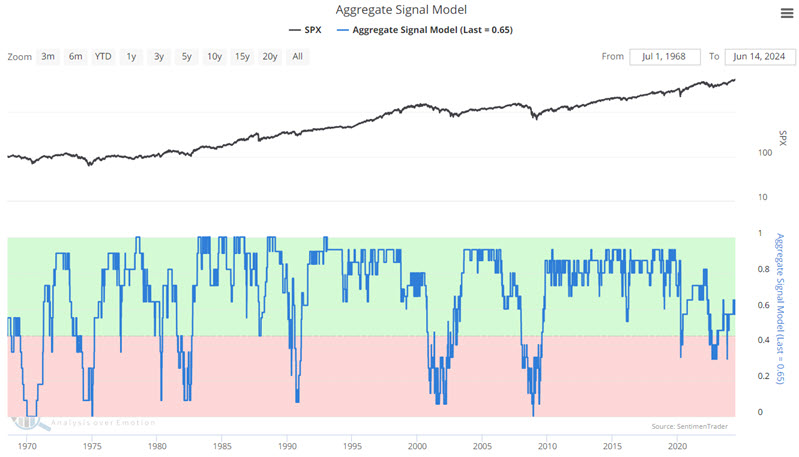
The Aggregate Signal Model flashes a continuation signal
Our Aggregate Signal Model is an aggregate buy/sell signal based on all our buy/sell signals. In the simplest form of this model, the idea is to be 100% long when the model reading is > 45% (0.45), as shown in the chart below.
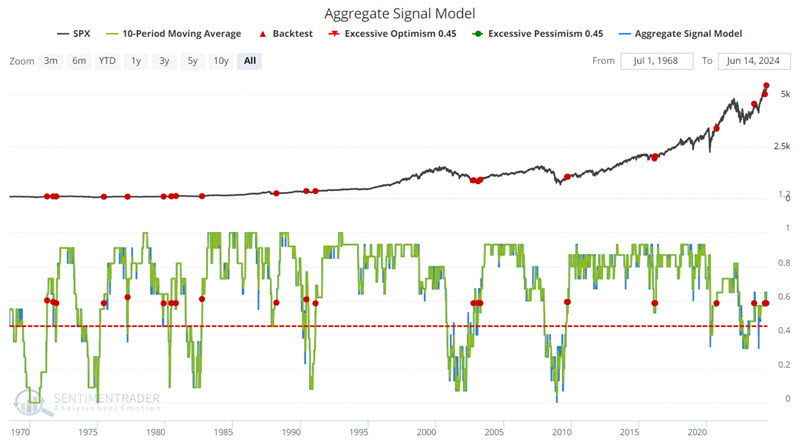
A variation involves using the model as a bullish "continuation" signal. The chart below highlights those dates when the 10-day moving average for our Aggregate Signal Model crossed above 0.58. The latest signal occurred on 2024-06-13.
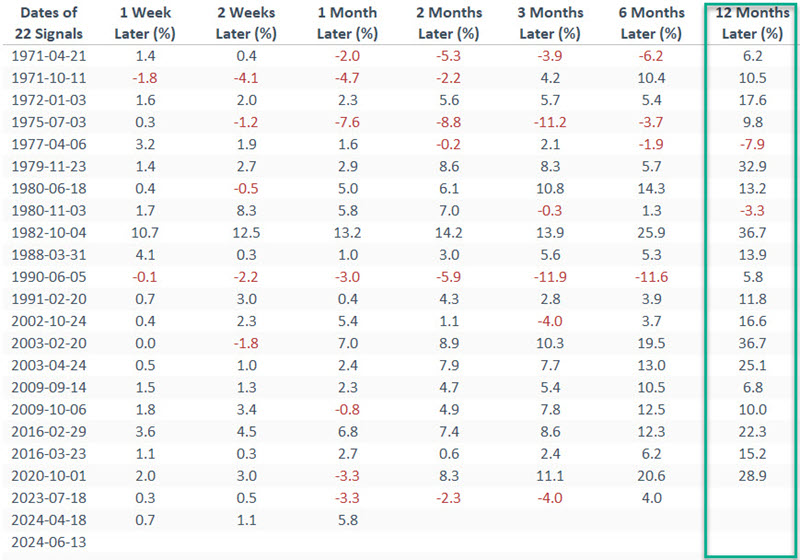
The table below displays S&P 500 performance following the dates highlighted in the chart above on a signal-by-signal basis.
The table below summarizes S&P 500 performance following the signal dates highlighted above.
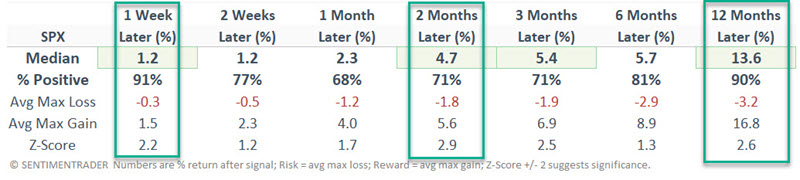
The results shown above offer some potential reassurance to longer-term investors who prefer to remain fully invested but are getting spooked by recent breadth concerns (and the financial press's ever-constant "gloom and doom" rhetoric).
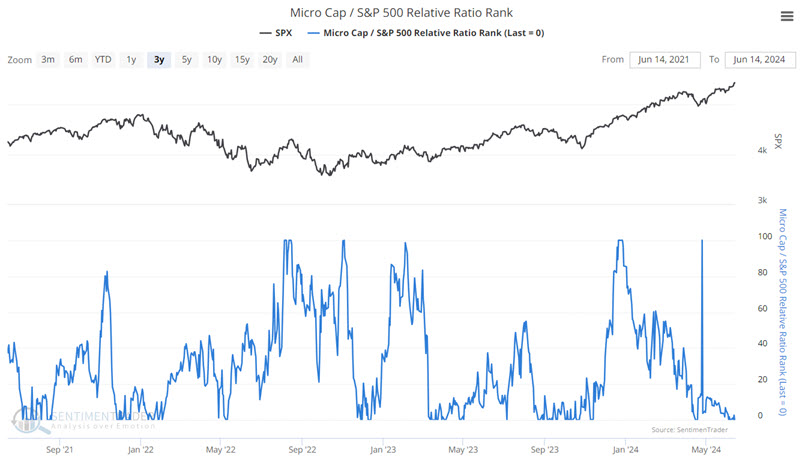
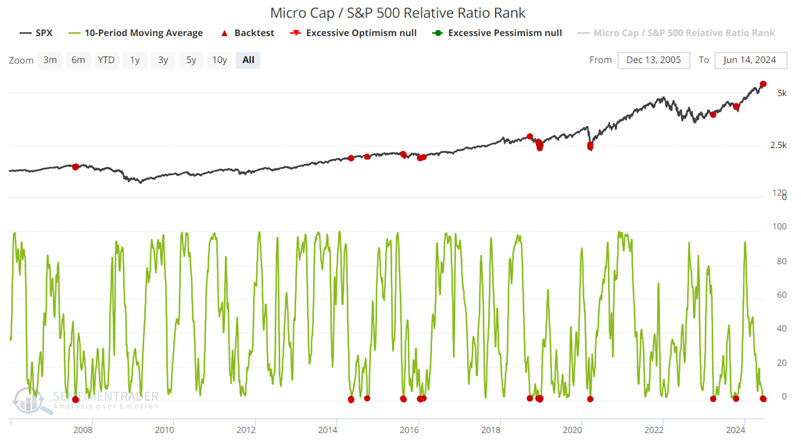
The Micro Cap / S&P 500 Relative Ratio Rank reaches a washed-out level
As the name implies, this indicator measures the performance of ultra-small-cap stocks relative to the S&P 500 Index. This chart shows where the ratio is relative to its range over the past four months. When the relative ratio is high, investors are showing risk-on behavior. When the ratio drops to a low level, they exhibit risk-off behavior.
As with the previous indicator, there is more than one way to interpret the information this indicator provides.
While low readings tend to point to "risk-off" behavior, the lower the reading and the longer it stays there, the greater the potential for a washout in risk-off sentiment. The chart below highlights those dates when the 10-day moving average for this indicator was below 1.5, including overlapping signals. The most recent signal occurred on 2024-06-14.
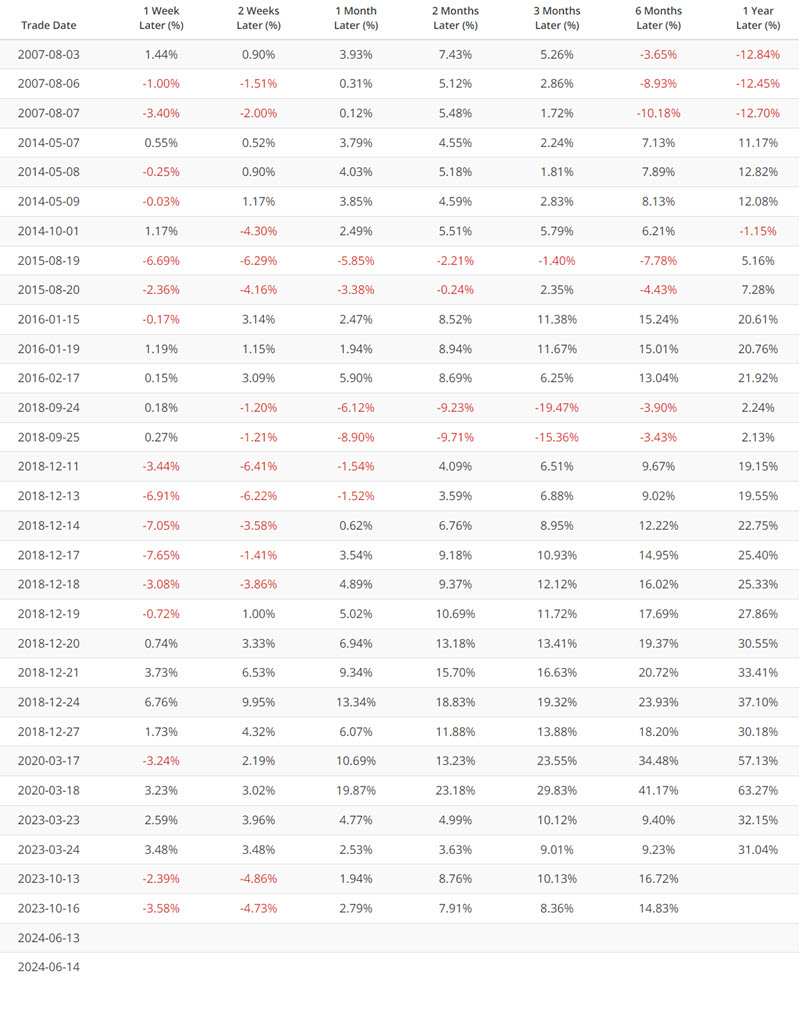
It should be noted that this can be more of an "early alert" signal than an actual "buy" signal. Bottom line: This signal should be considered as "weight of the evidence" and not as a standalone trading model generating automatic buy and/or sell signals. With that caveat in mind, the table below displays subsequent S&P 500 performance following the signal dates highlighted in the chart above on a signal-by-signal basis, including overlapping signals.
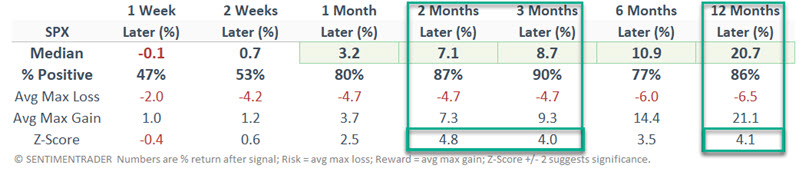
 The table below summarizes subsequent S&P 500 Index performance following the dates highlighted above.
What the research tells us…
No bull market ever advances in a straight line. Even the greatest bull markets experience pullbacks - often of uncomfortably meaningful size - along the way. The S&P 500 Index has gained 55% since its October 2022 low and 32% since its October 2023 low. With several breadth indicators flashing warning signs (as well documented by Jason and Dean), a pullback of some size should not be a shock. Nevertheless, the message to long-term investors from the abovementioned indicators suggests that long-term investors with a buy-and-hold bent ignore the noise and "stay the course" with their long-term investment plan.