
Analyzing SPY day-by-day

Key Points
- Does the day of the week matter in the stock market?
- Is performance different intraday than it is overnight?
- Do opening gaps matter?
- In this piece, we take a closer look at the answers to these questions
Testing SPY
For our testing, we will use daily open/high/low/close data for SPY (SPDR S&P 500 ETF Trust) from 1/29/1993 through 3/7/2022. Note that no allowances are made for slippage or commissions. We are strictly analyzing price changes.
For each day of the week, we will examine:
- Performance from the previous close to today's open (i.e., overnight price change)
- Performance from today's open to today's close (i.e., intraday price change)
- Performance from today's open to today's close IF today's open is higher than the previous close
- Performance from today's open to today's close IF today's open is lower than or equal to the previous close
The data will be presented as is, with no intended inferences about what may be helpful and what may not.
Previous close to today's open versus today's open to close
The first chart below shows the growth of $1 in SPY held only overnight (black line) versus the growth of $1 in SPY held intraday, i.e., open to close (blue line) for ALL trading days. The 2nd chart shows the same data on a logarithmic scale.
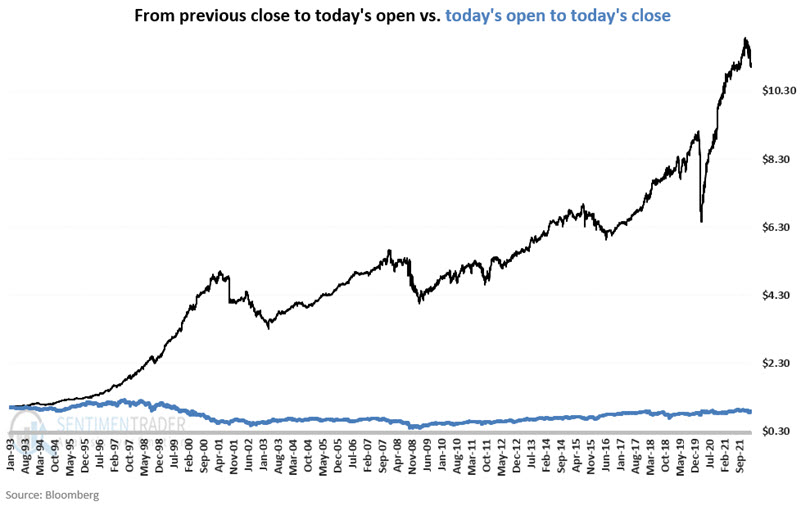
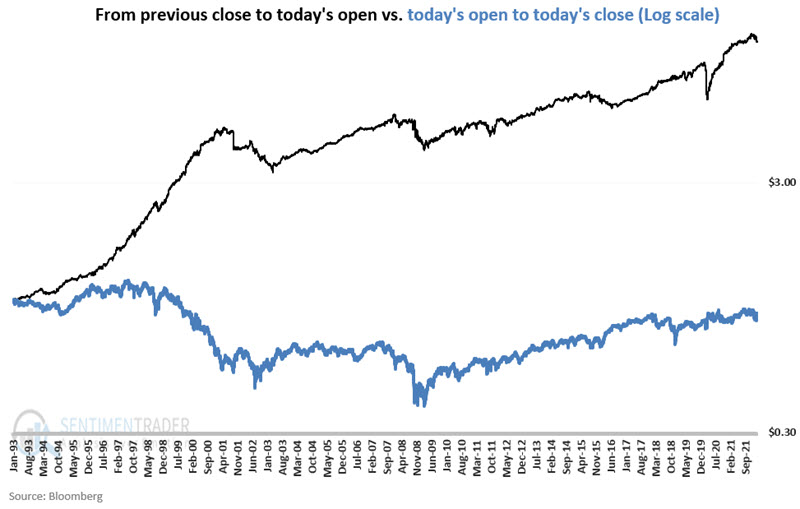
Results
- Overnight % +(-) = +1,000.9%
- Intraday % +(-) = (-13.3%)
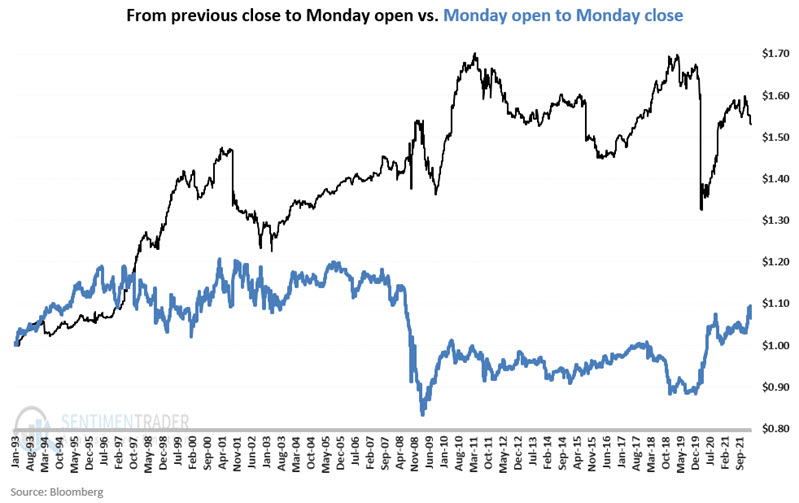
Monday
The first chart below shows the growth of $1 in SPY held only overnight (black line) into Mondays open versus the growth of $1 in SPY held intraday, i.e., open to close only on Monday (blue line).
The next chart shows the growth of $1 in SPY held intraday if SPY opened higher versus the growth of $1 in SPY held intraday if SPY opened lower or unchanged.
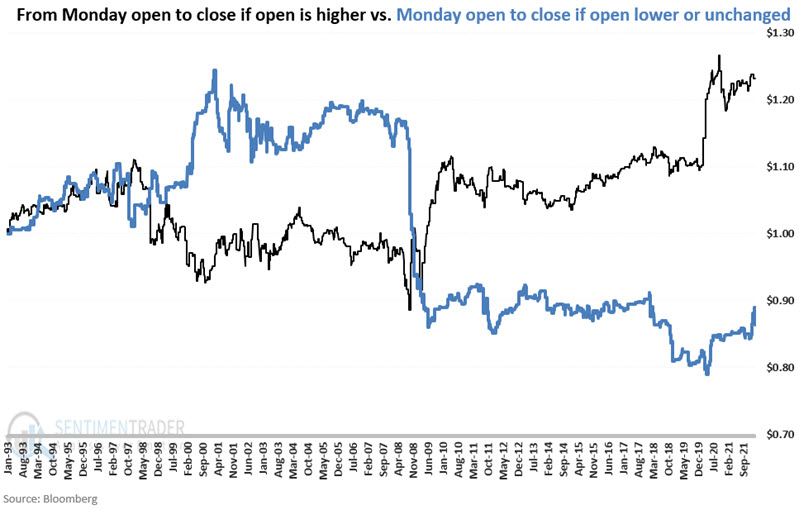
Results
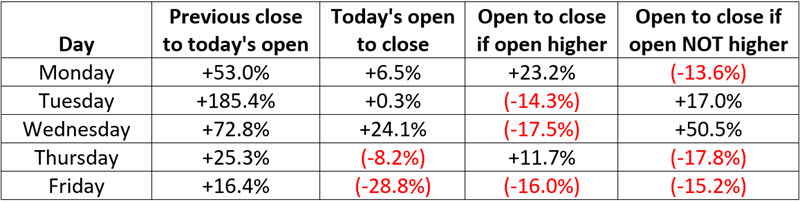
- Overnight % +(-) = +53.0%
- Net Intraday % +(-) = +6.5%
- Intraday % +(-) if higher open = +23.2%
- Intraday % +(-) if lower open = (-13.6%)
Tuesday
The first chart below shows the growth of $1 in SPY held only overnight (black line) into Tuesday's open versus the growth of $1 in SPY held intraday, i.e., open to close only on Tuesday (blue line).
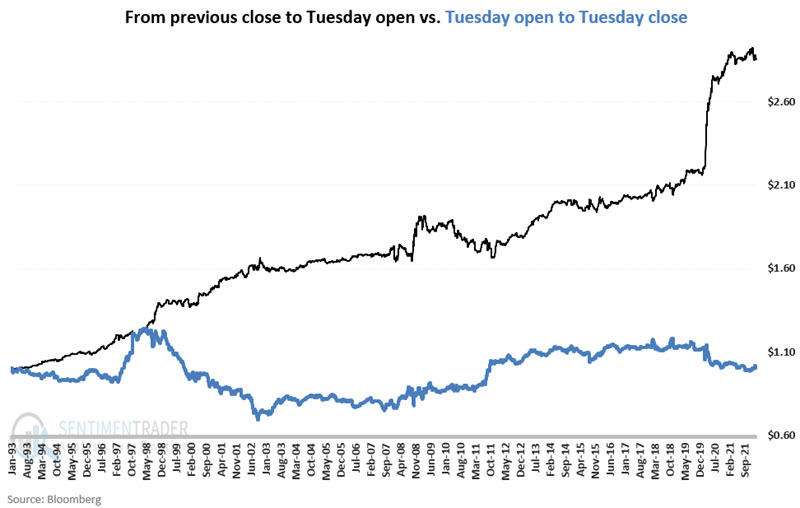
The next chart shows the growth of $1 in SPY held intraday if SPY opened higher versus the growth of $1 in SPY held intraday if SPY opened lower or unchanged.
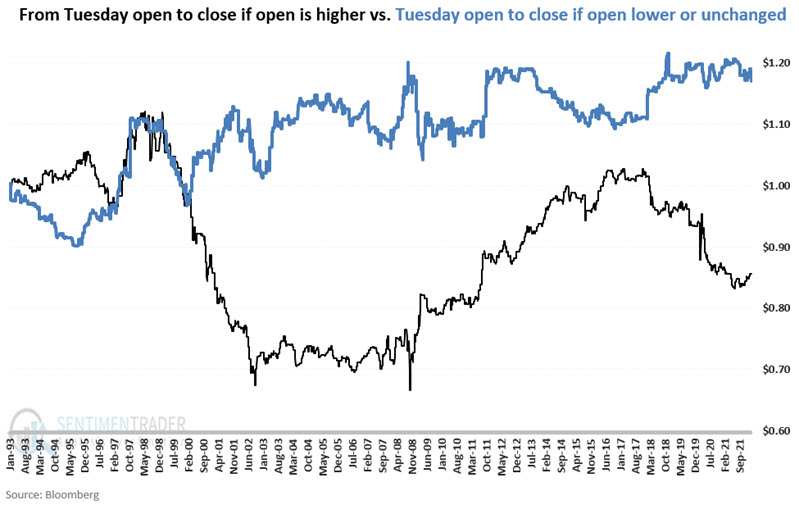
Results
- Overnight % +(-) = +185.4%
- Net Intraday % +(-) = +0.3%
- Intraday % +(-) if higher open = (-14.3%)
- Intraday % +(-) if lower open = +17.0%
Wednesday
The first chart below shows the growth of $1 in SPY held only overnight (black line) into Wednesday's open versus the growth of $1 in SPY held intraday, i.e., open to close only on Wednesday (blue line).
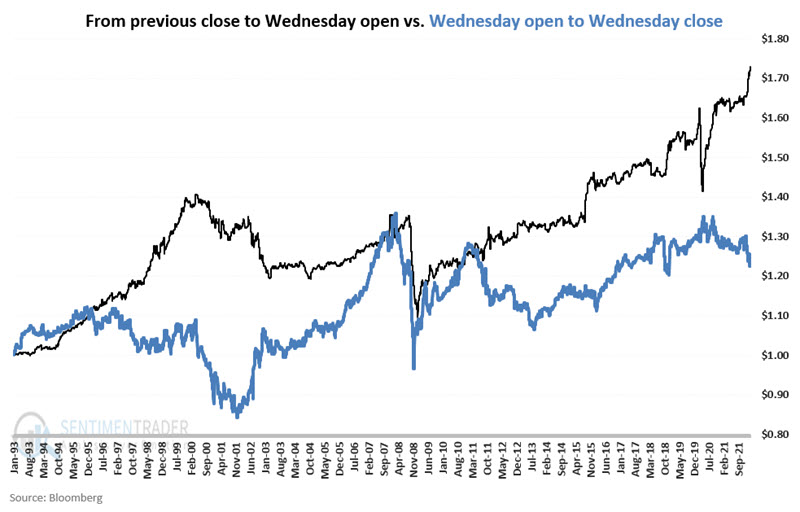
The next chart shows the growth of $1 in SPY held intraday if SPY opened higher versus the growth of $1 in SPY held intraday if SPY opened lower or unchanged.
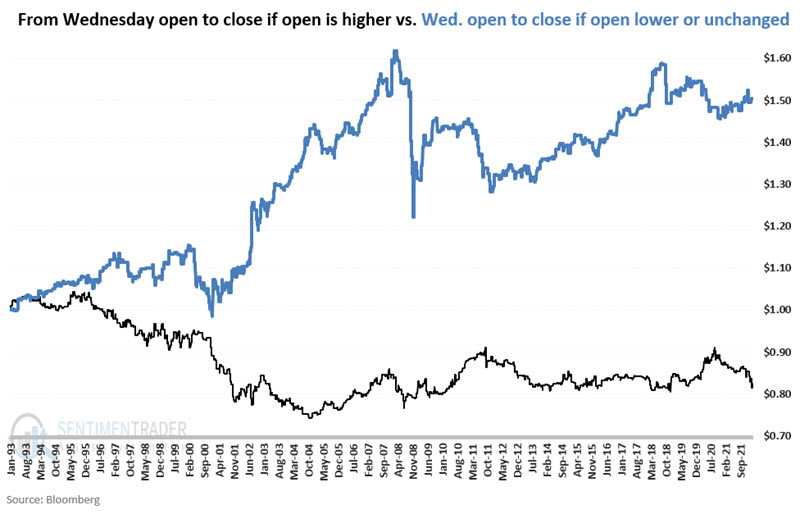
Results
- Overnight % +(-) = +72.8%
- Net Intraday % +(-) = +24.1%
- Intraday % +(-) if higher open = (-17.5%)
- Intraday % +(-) if lower open = +50.0%
Thursday
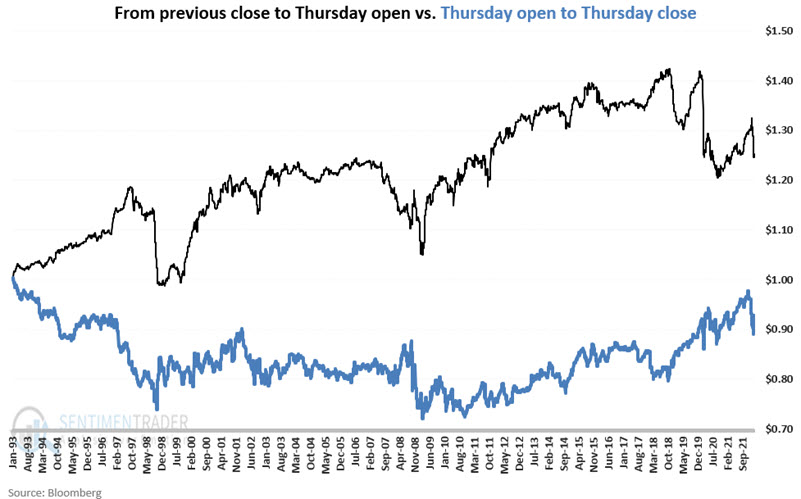
The first chart below shows the growth of $1 in SPY held only overnight (black line) into Thursday's open versus the growth of $1 in SPY held intraday, i.e., open to close only on Thursday (blue line).
The next chart shows the growth of $1 in SPY held intraday if SPY opened higher versus the growth of $1 in SPY held intraday if SPY opened lower or unchanged.
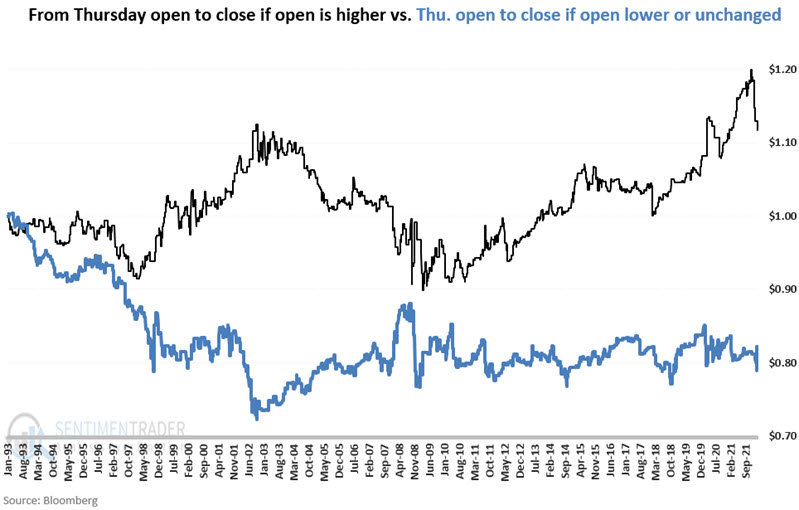
Results
- Overnight % +(-) = +25.3%
- Net Intraday % +(-) = (-8.2%)
- Intraday % +(-) if higher open = +11.7%
- Intraday % +(-) if lower open = (-17.8%)
Friday
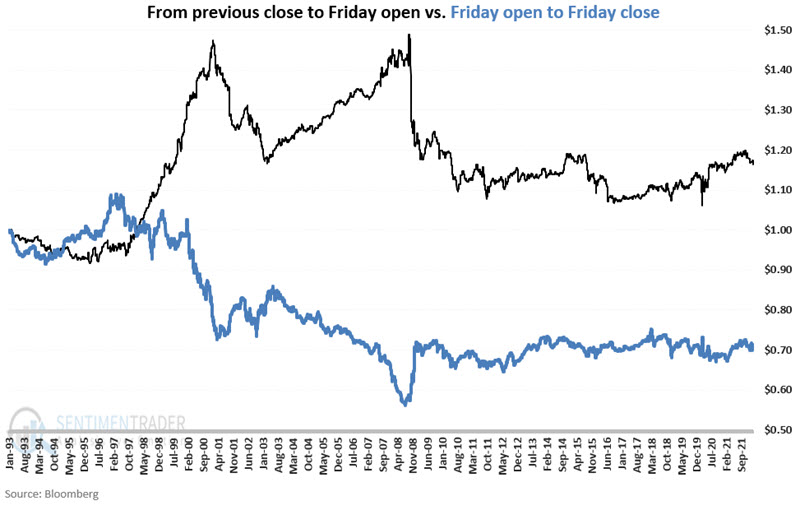
The first chart below shows the growth of $1 in SPY held only overnight (black line) into Thursday's open versus the growth of $1 in SPY held intraday, i.e., open to close only on Thursday (blue line).
The next chart shows the growth of $1 in SPY held intraday if SPY opened higher versus the growth of $1 in SPY held intraday if SPY opened lower or unchanged.
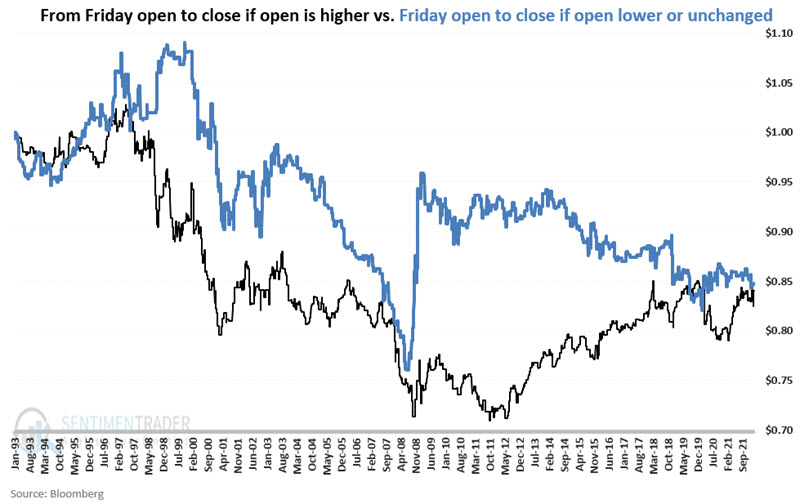
Results
- Overnight % +(-) = +16.4%
- Net Intraday % +(-) = (-28.8%)
- Intraday % +(-) if higher open = (-16.0%)
- Intraday % +(-) if lower open = (-15.2%)
Summary of Results
What the research tells us…
Some general observations:
- Holding overnight accounted for all gains
- Holding intraday showed a small net loss
- Tuesday and Wednesday are "turnaround" days (i.e., higher opens lead to lower closes and vice versa)
- Monday and Thursday are "continuation" days (i.e., higher opens lead to higher closes and vice versa)
- Friday is the worst day to hold intraday, but the best day to buy at the close