
An Update on Hedging GLD with Options

Key points:
- Last week, I wrote about an example trade to hedge a long position in GLD shares
- In this piece, I will update the unhedged and hedged positions following this week's selloff in Gold
A quick review
In this article dated 2025-10-17, I compared two hypothetical positions entered on October 16th:
- Holding long 200 shares of GLD (unhedged)
- Holding long 200 shares of GLD, selling one Jan2026 400 strike price call, and buying two Jan2026 380 strike price puts (hedged position)
After nine straight up weeks, gold and GLD have finally experienced a pullback. How have the two positions performed? Let's take a closer look.
Long 200 shares of GLD updated
The table below shows the status of the long 200 shares of GLD position (with no hedge) since the hypothetical trades were initiated last week.
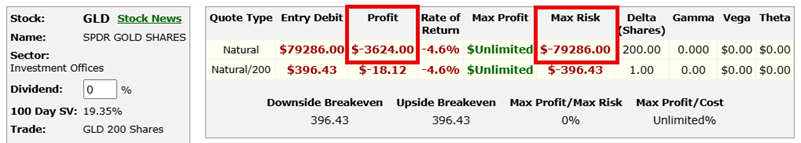
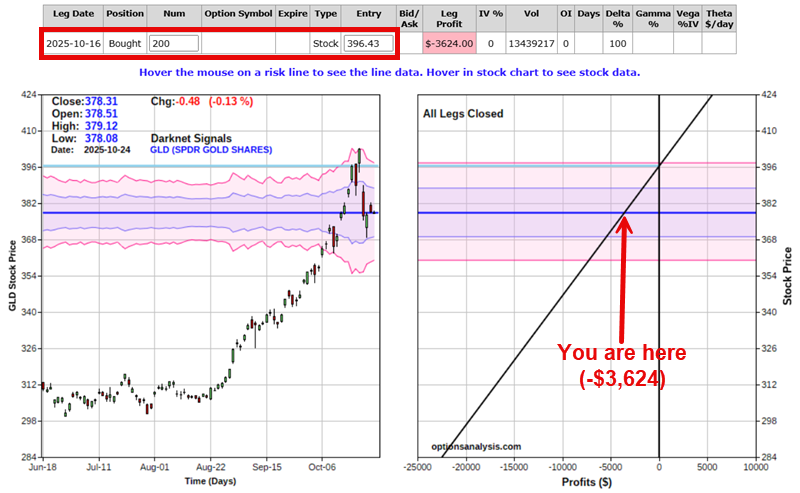
The key thing to note is that as of roughly 9:15 Central time on October 20th, this position (long 200 shares of GLD) was down -$3,624, as GLD has fallen from roughly $396 to roughly $378.
In the chart below, we see the expected $ gain or loss for this position based on the price movement of GLD shares. The key point to note is that if the price continues to decline, downside risk is essentially unlimited.
Now let's look at the hypothetical hedged position.
Long 200 shares of GLD, short one call, and long two puts updated
The table below shows the status of the hedged position since the hypothetical trades were initiated last week.
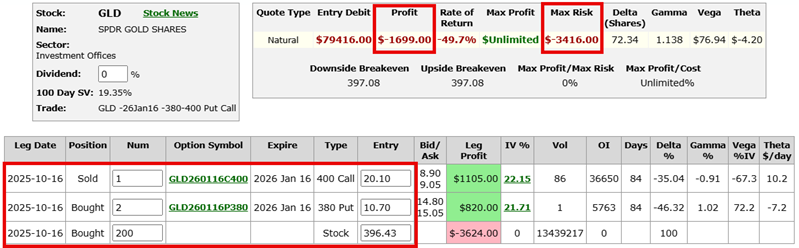
The key thing to note is that of roughly 9:15 Central time on October 20th, this position (long 200 shares of GLD, short one 400 call, and long two 380 puts) was down -$1,699 - far less (for now) than the -$3,624 open loss for the unhedged position.
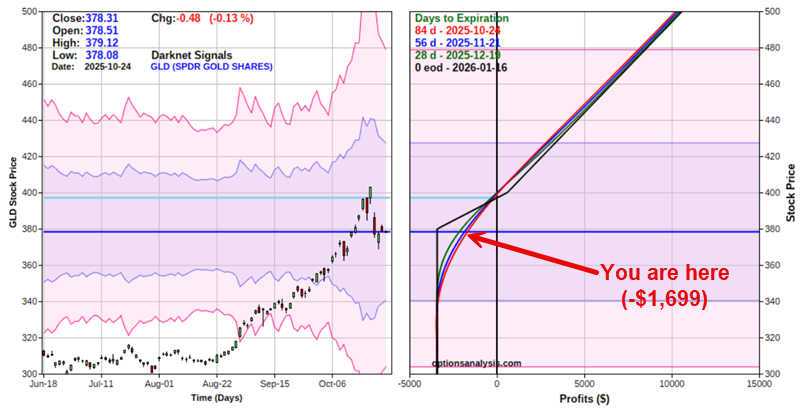
The chart below shows this position's expected $ gain or loss based on the price movement for GLD shares. Each colored line represents the expected P/L as of a different date leading up to option expiration in January 2026. The red line represents today, while the black line represents expiration day.
The key point is that if the price continues to decline, downside risk is completely limited to a maximum of -$3,416, no matter how far gold may fall. This is because below $380 a share, every dollar lost on the long 200 shares portion of the trade is offset by a dollar gained by holding two long put options.
The chart below draws the risk curves for both positions together to better illustrate the tradeoff. The gray line represents the expected P/L for holding 200 shares of GLD (the unhedged position) and the expected P/L for the hedged position at option expiration in January 2026.
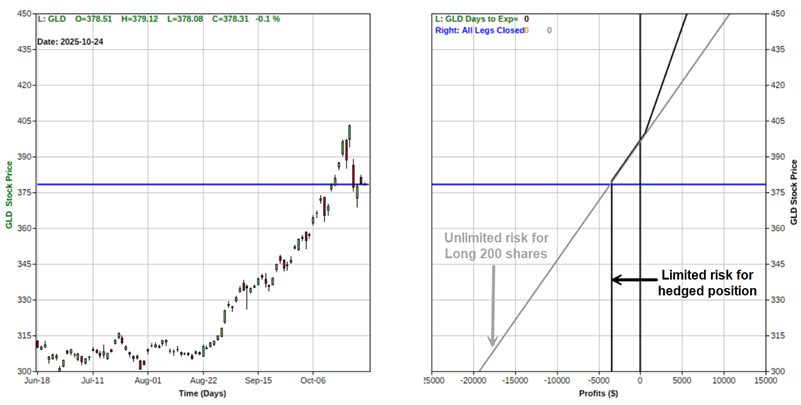
This chart clearly shows the tradeoff in downside risk between the two positions. From here:
- A trader who is concerned that Gold could fall further would likely leave the hedge in place for a while longer
- Conversely, a trader who thinks that the worst is over and that GLD will embark on another significant up leg from here might consider taking off the hedge to achieve full upside-profit potential
What the research tells us…
Hedging can help a trader to offset risk. However, it does come at a price. In most cases, when a trader hedges a long position using options, they either a) pay out money to enter the hedge (i.e., there is an additional dollar cost involved), and/or b) they give up a certain amount of upside profit potential to limit downside risk. So far, the example hedged position presented here has reduced an open loss and offered a complete limit on downside risk (beyond -$3,624). Nevertheless, if GLD reverses and runs sharply higher from here, an unhedged trader could still come out far ahead.