Products
SentimenTrader Trading Tools
‍
Backtest Engine
My Trading Toolkit
Correlation Analysis
Seasonality
Market Prediction
Indicators & Data API
‍
Proprietary Indicators & Charts
Market Data API
Strategies & Scanner
‍
50+ Trading Strategies
Smart Stock Scanner
Smart Option Scanner
Research Reports
‍
Research Solutions
Reports Library
Free Resources
Simple Backtest Calculator
Simple Seasonality Calculator
The Kelly Criterion Calculator
Sentiment Geo Map
Public Research Reports
Education
Sentiment Indicators
Technical Indicators
Pricing
Company
About
In the News
Testimonials
Client Success Stories
Contact
Log inLoginSign up
< BACK TO ALL REPORTS

An unprecedented rise in the 10-year Treasury yield

Dean Christians
2024-10-30
The 10-year Treasury bond yield has surged by more than 65 basis points in 30 days, marking one of the most significant increases in history. Similar spikes near the start of Federal Reserve easing cycles have historically been rare, often resulting in a drop in the benchmark yield and a rally in equities.

Key points:

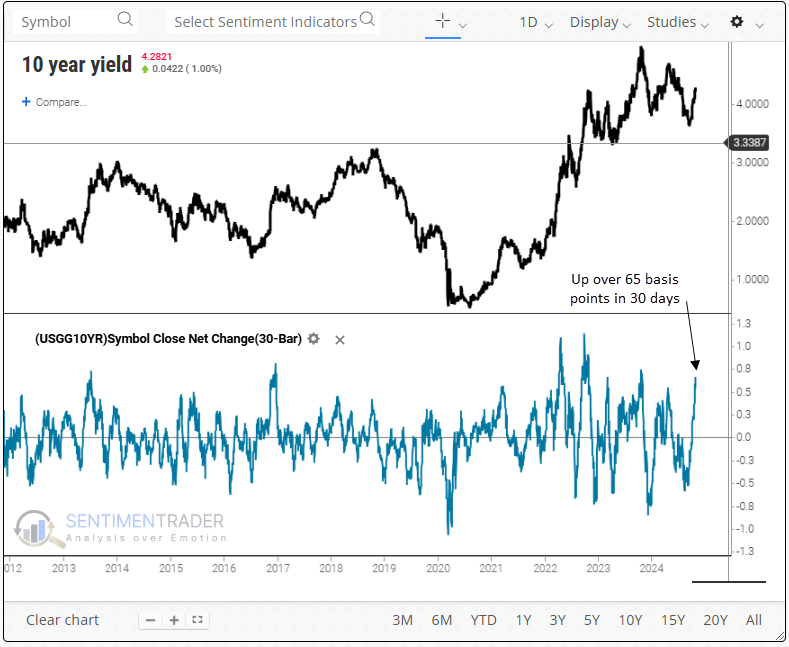
  • The 10-year Treasury yield has risen more than 65 basis points over 30 days
  • Similar surges with the Fed easing policy suggest the 10-year yield could decline in the near term
  • Stocks managed to rally in the face of rising rates, achieving a 100% win rate in the following year

Should we be concerned about the rapid rise in long-term interest rates

Social media is abuzz with traders debating why the 10-year yield is surging and what the trickle-down effect could be on the economy, given that it's a critical lending benchmark. 

Over a rolling 30-day period, the 10-year Treasury yield has climbed over 65 basis points, a magnitude of change exceeded in only 4% of trading days since 1962. 

Although a 65 bps increase over 30 days has occurred 47 other times when using a reset below zero to eliminate repeats, none took place in tandem with the Federal Reserve's initial rate cut until now. 

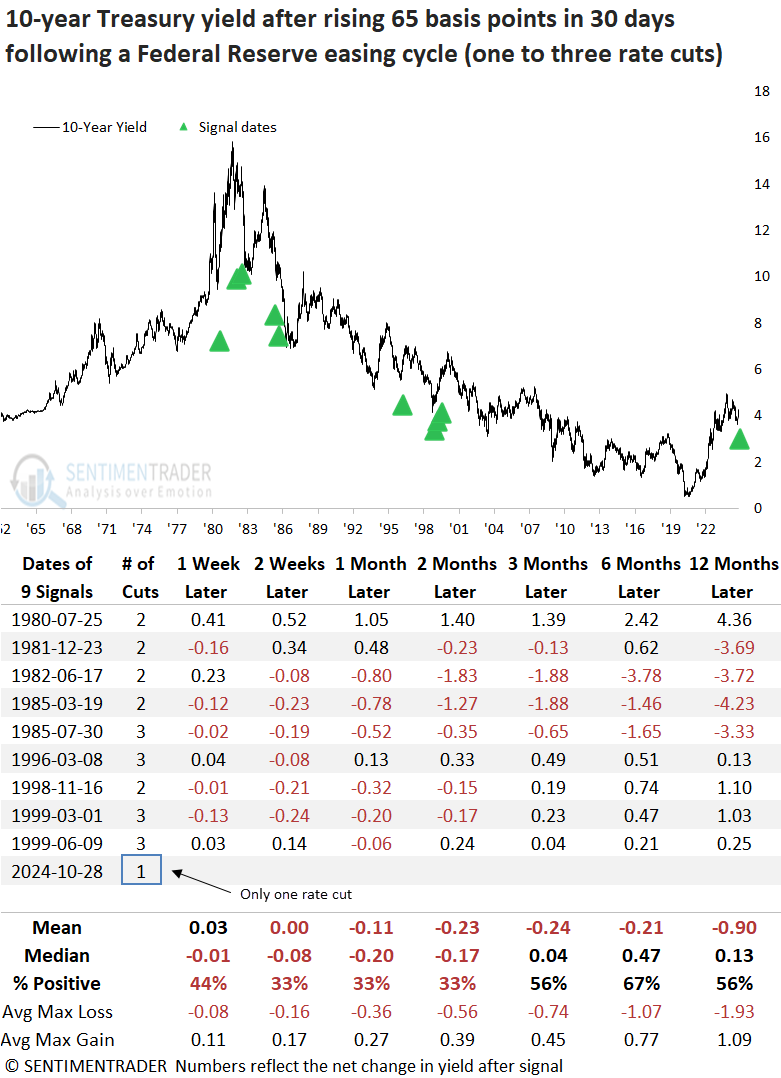
Comparable surges in the 10-year yield preceded a near-term drop in rates  

Whenever the 10-year Treasury yield rose by 65 basis points over 30 days, coupled with a Fed easing cycle featuring one to three rate cuts, the benchmark yield often decreased over the following months. From three to twelve months later, yields dropped in the 1980s, whereas post-1995, they tended to increase.

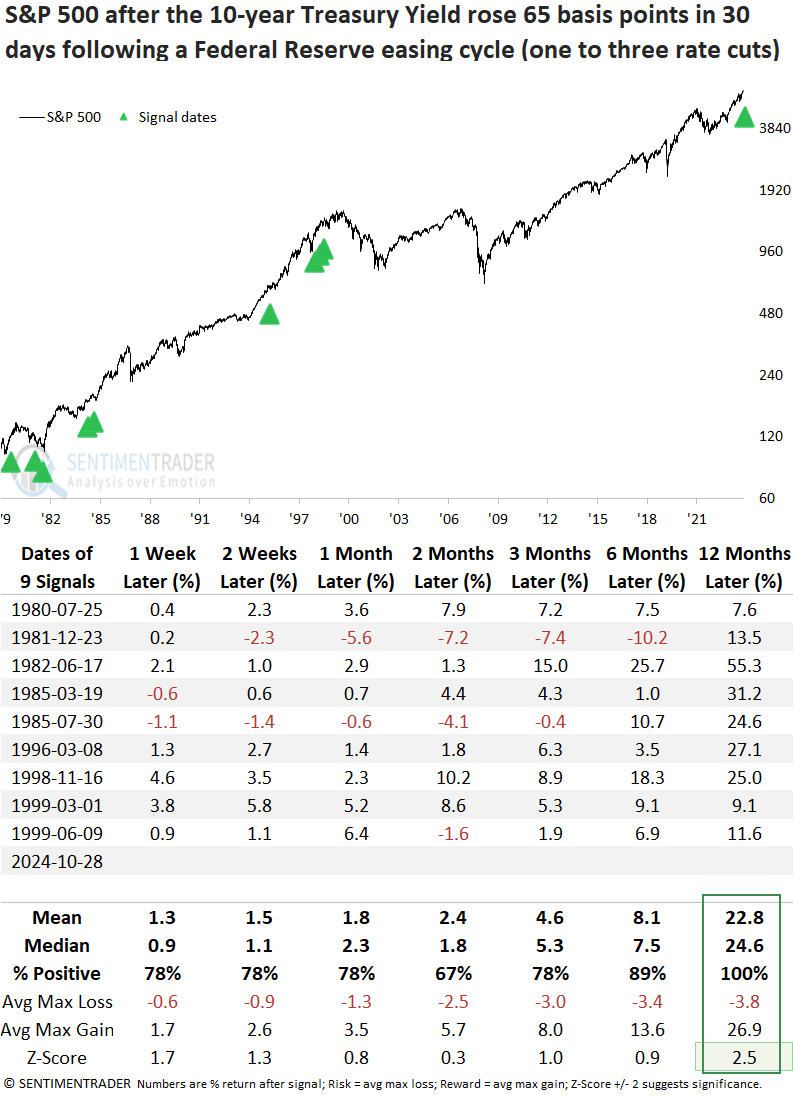
Stocks didn't miss a beat despite a rapid rise in the 10-year yield

Except for an untimely signal in 1981, which occurred within the context of a bear market, a scenario unlike today, the S&P 500 rallied consistently across all time frames, culminating in a 100% win rate over the next year. 

The market's ability to absorb a sudden and sharp rise in rates suggests that economic fundamentals were healthy during these periods, providing a positive backdrop for equities. 

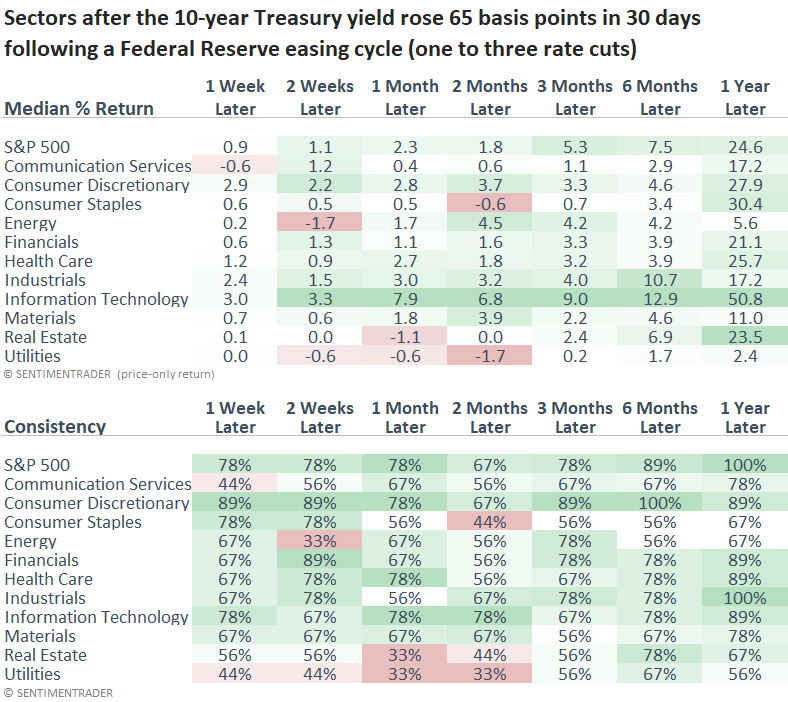
Consistent with their defensive nature, sectors such as Staples, Health Care, and Utilities lagged the S&P 500 over the initial six months. A year later, most sectors, particularly technology, achieved robust returns.

What the research tells us...

Many factors could be driving the sharp and sudden surge in the 10-year Treasury yield. Those include a resilient economy, Treasury issuance, or a technical bounce in yields following a decline. Regardless of the narrative, similar spikes in the 10-year Treasury yield near the outset of a Federal Reserve easing cycle have often reversed, leading to lower yields over the subsequent months. Notably, these reversals have correlated with S&P 500 rallies, especially over the following year. This trend likely reflects a healthy economy that fuels corporate profits, fostering a more favorable stock market environment.

PRODUCTS
SentimenTrader
Trading Tools
Indicators & Data API
‍
Strategies & Scanner
‍
Research Reports
FREE
RESOUrCES
Simple Backtest
Calculator
Simple Seasonality
Calculator
The Kelly Criterion
Calculator
Sentiment Geo Map
‍
Public Research Reports
‍
Education
Sentiment Indicators
‍
Technical Indicators
‍
Pricing
Bundle pricing
‍
FAQ
‍
Announcements
‍
COMPANY
‍
About
‍
In the News
‍
Testimonials
‍
Client Success Stories
CONTACT
‍
General Inquiries
‍
Media Inquiries
‍
Financial Professionals Inquiries
‍
© 2026 Sundial Capital Research Inc. All rights reserved.
Setsail Marketing
TermsPrivacyAffiliate Program
Risk Disclosure: The information and tools provided are for research and analytical purposes only and are not intended as investment advice. Market analysis involves uncertainty, and outcomes may differ from expectations. Users should conduct their own due diligence and consider their individual circumstances before making any financial decisions. Past performance is not necessarily indicative of future results.

Hypothetical Performance Disclosure: Hypothetical performance results have many inherent limitations, some of which are described below. No representation is being made that any account will or is likely to achieve profits or losses similar to those shown; in fact, there are frequently sharp differences between hypothetical performance results and the actual results subsequently achieved by any particular trading program. One of the limitations of hypothetical performance results is that they are generally prepared with the benefit of hindsight. In addition, hypothetical trading does not involve financial risk, and no hypothetical trading record can completely account for the impact of financial risk of actual trading. for example, the ability to withstand losses or to adhere to a particular trading program in spite of trading losses are material points which can also adversely affect actual trading results. There are numerous other factors related to the markets in general or to the implementation of any specific trading program which cannot be fully accounted for in the preparation of hypothetical performance results and all which can adversely affect trading results.

Testimonial Disclosure: Testimonials appearing on this website may not be representative of other clients or customers and is not a guarantee of future performance or success.