
An unorthodox approach to the bond market

Key points
- Income investors face a unique challenge these days; Securities offering a decent yield can be quite volatile when rates fluctuate (increasing risk to capital), but low-volatility income securities tend to provide low returns
- Can an active trading approach make sense for a long-term income-oriented investor?
- One approach may be to incorporate our CDX Index indicator to decide when to be "risk on" or "risk off"
The basic idea
The basic idea is to switch between a more volatile, higher-yielding security with some growth potential during "risk on" periods and into a safe, low-volatility security during "risk off" times. We will use the CDX Index to distinguish between "risk on" and "risk off" periods.
The CDX Index as a risk-on, risk-off tool
Over the past few years, one of the fastest-growing derivatives markets has been that for credit default swaps (CDS). A CDS allows the various parties to swap the exposure of default of the underlying credit (i.e., bond).
For example, an investor in a relatively risky bond might be uncomfortable with the issuer's potential payment default. To hedge that risk, the investor buys a CDS. When they purchase the CDS, the investor pays another trader (the seller) a periodic payment. That other trader then takes on the risk that the bond issuer will default. If that happens, the seller is responsible for paying the bond investor an agreed-upon amount.
This allows the original investors to offset some of their risk, the seller to generate a stable flow of income, and the bond market to enjoy more liquidity. Of course, just like selling options, the seller of a CDS takes on possibly significant risks, and a major system-wide event could trigger a massive wave of trouble since this market has become so huge.
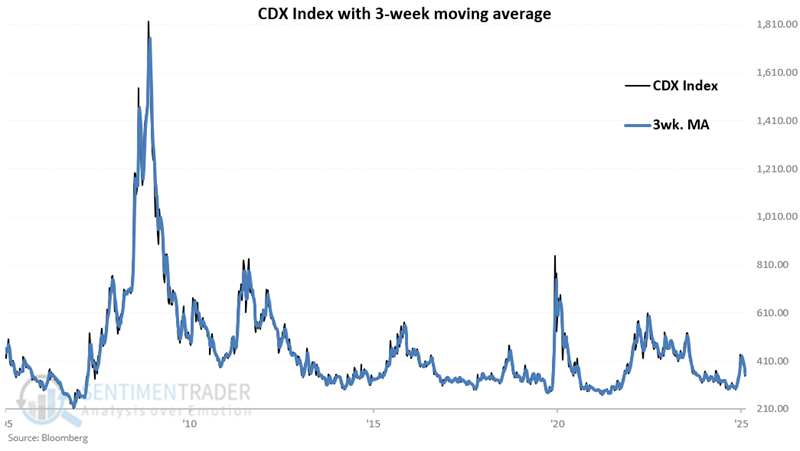
As posted to the site, the indicator tracks an index created by Dow Jones that monitors the spread between credit default swaps on high-yield (i.e., junk) bonds and Treasury securities. The higher the index, the wider the spread. This means credit investors are increasingly worried about defaults and willing to pay higher prices for default protection.
For our purposes, a rising trend (we will define how we designate "trend" in a moment) signifies a "risk off" period, and a declining trend represents a "risk on" period.
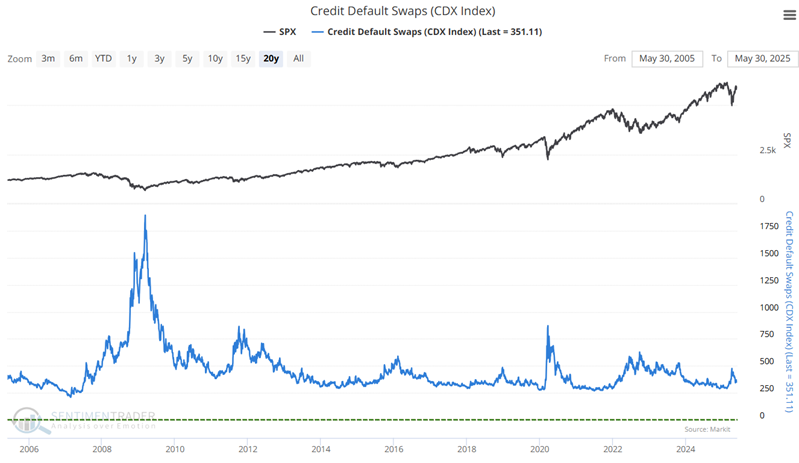
Note that the chart above shows daily values. For the test below, we will use weekly data for the CDX Index, looking only at the week's close.
The securities - one high-yield, the other low volatility
The basic idea is to combine a higher-yielding security (which might also enjoy meaningful capital appreciation) held during risk-on periods, with a very low volatility security held during risk-off periods to maximize gains when things are good and limit risk otherwise.
NOTE: The securities used in this example are not "recommended" securities per se; they are merely examples of vehicles that might make sense with the approach we discuss.
The two securities we will use for this test are the Neuberger Berman High Yield Strategies Fund (ticker NHS) and the SPDR® Bloomberg 1-3 Month T-Bill ETF (ticker BIL). For both, we use weekly total return data. Note that NHS is a closed-end fund and BIL is an ETF. Both can be bought or sold in a brokerage account just like shares of stock.
NHS invests in fixed-income markets worldwide. The fund typically invests in high-yield debt securities from various sectors, such as auto parts and equipment, airlines, automotive, electronics, health services, packaging, telecom-integrated/services, gaming, and gas distribution.
BIL seeks to provide investment results that, before fees and expenses, correspond generally to the price and yield performance of the Bloomberg 1-3 Month U.S. Treasury Bill Index. It seeks to provide exposure to publicly issued U.S. Treasury Bills that have remaining maturities between 1 and 3 months. Short-duration fixed income is less exposed to fluctuations in interest rates than longer-duration securities
The chart below displays the hypothetical growth of $1 invested in NHS and BIL on a buy-and-hold basis, respectively. NHS offers the potential for decent capital gains but with significant volatility. Meanwhile, BIL offers highly stable but low returns.
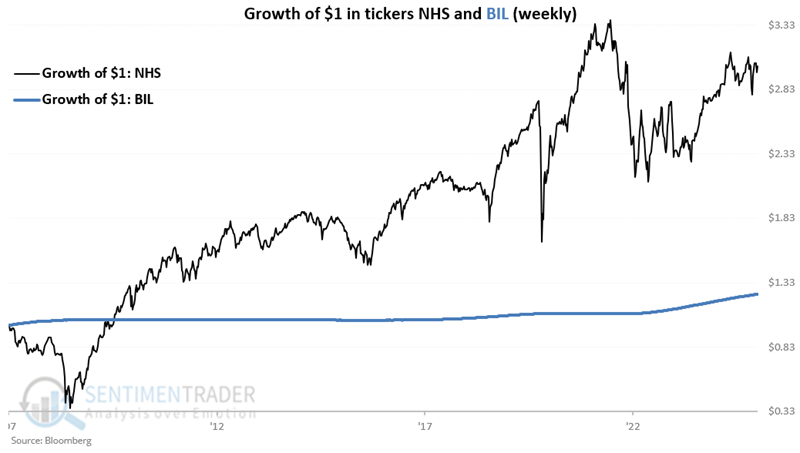
Note that NHS is capable of huge price swings in both directions. On the other hand, BIL is not volatile at all, but also spent time trading essentially sideways while the Fed held short-term interest rates near zero.
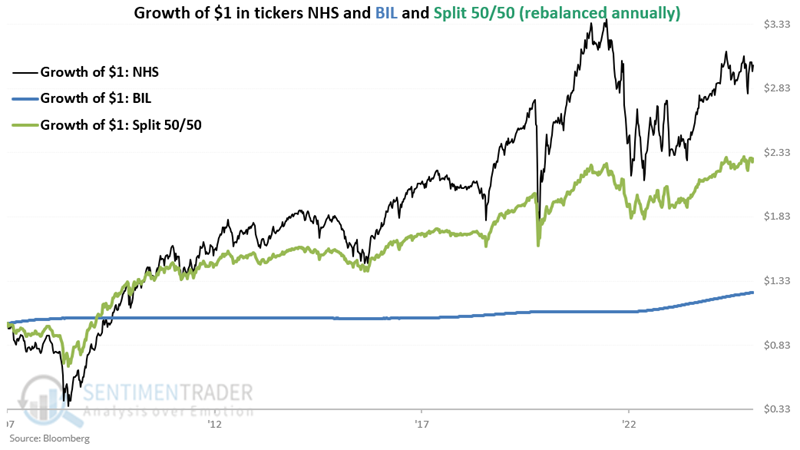
One investment alternative might be to split 50/50 between the two and rebalance every January. The hypothetical growth of $1 using this approach is added to the two above in the chart below green line).
The table below summarizes results for all three strategies.
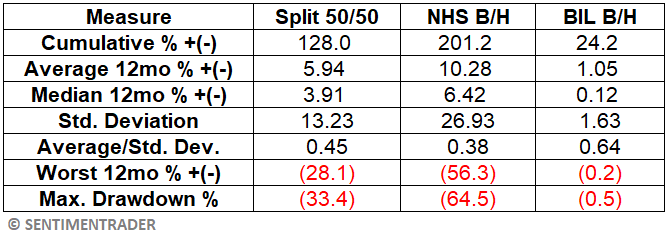
You can see the drawbacks:
- Buying and holding NHS showed an average 12-month return of 10.28% but with a maximum drawdown of -64.5%!
- BIL experienced a maximum drawdown of only -0.5% but earned an average 12-month return of just 1.05%.
- Finally, the 50/50 method registered an average 12-month return of 5.94% with a maximum drawdown of -33.4%
None of these is particularly attractive. So, is it time to "throw in the towel?" Perhaps, but let's consider one other alternative.
A trading approach using the CDX Index
The method we will test involves assessing the CDX Index versus its 3-week moving average at the end of each week as follows:
- If the CDX Index is below its 3-week moving average, we will switch into NHS
- If the CDX Index is above its 3-week moving average, we will switch into BIL
When the CDX Index is below its 3-week moving average, we will call that "risk on" and hold the more volatile NHS. When the CDX Index is above its 3-week moving average, we will call that "risk off" and hold the low-volatility BIL.
The "catch" is that this is a very active approach, as the CDX Index can fluctuate often. Note that this method averages almost 20 "trades" per year. So make no mistake: Even though the goal is to execute an "income" strategy, the technique undoubtedly involves much more active trading than most "income investors" are used to or are comfortable with. This also suggests that this approach would be best used in a non-taxable account to avoid an endless stream of short-term capital gains or losses.
What we have is an admittedly very unorthodox and uncomfortable strategy for income investors who tend to trade only rarely. Nevertheless, it may at least be worth some consideration. Why? The chart below displays the hypothetical growth of $1 invested using this "switching" method, versus the 50/50 method (which involves just one trade per year in January to rebalance to 50% in each security) detailed above.
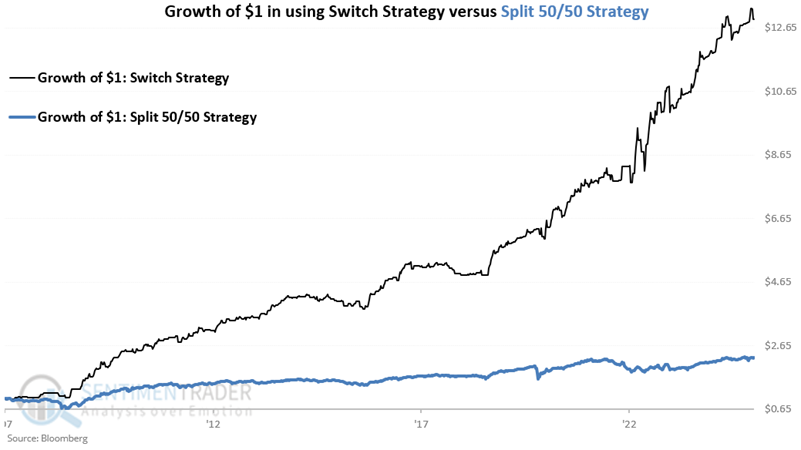
From June 2007, a hypothetical $1 invested using:
- The 50/50 "split" method grew to $2.28
- The "Switch" method grew to $12.93
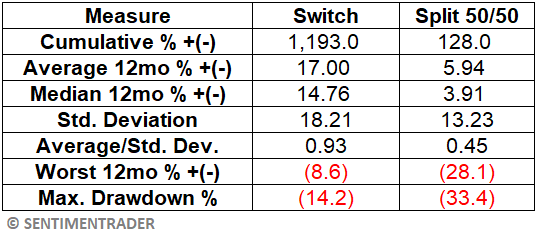
The table below summarizes the "Switch" method compared to the "Split" method. Note that these results are hypothetical using total return (i.e., price plus dividend) data.
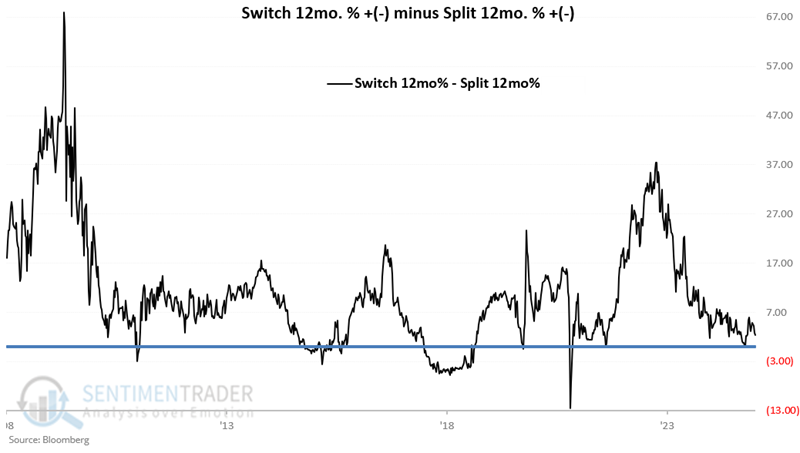
In the chart below, each week since 2008, we subtract the 12-month % rate-of-change for the 50/50 strategy from the 12-month % rate-of-change for the Switch strategy. Positive values indicate that the "Switch" method outperformed the "Split" method, and negative values indicate the opposite. The Switch method showed a higher 252-day return 89.4% of the time.
The chart below displays the % drawdowns for both strategies.
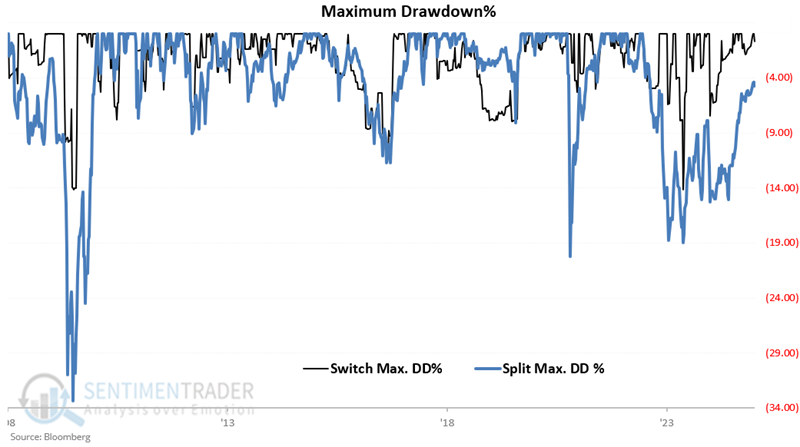
Note that the "Switch" method twice experienced a drawdown of roughly 14%, with a maximum drawdown of 14.2% (which some might admittedly consider to be relatively high for an "income" strategy) and on one other occasion experienced a drawdown in excess of 10%.
The "Split" method experienced four drawdowns over 10%, three over 15%, two over 20%, and one of -33.4%.
Where things stand now
The "Switch" strategy has already made nine trades in 2025. The most recent signal was a switch back into NHS, generated on 2025-05-30 (this followed a one-week hold of BIL).
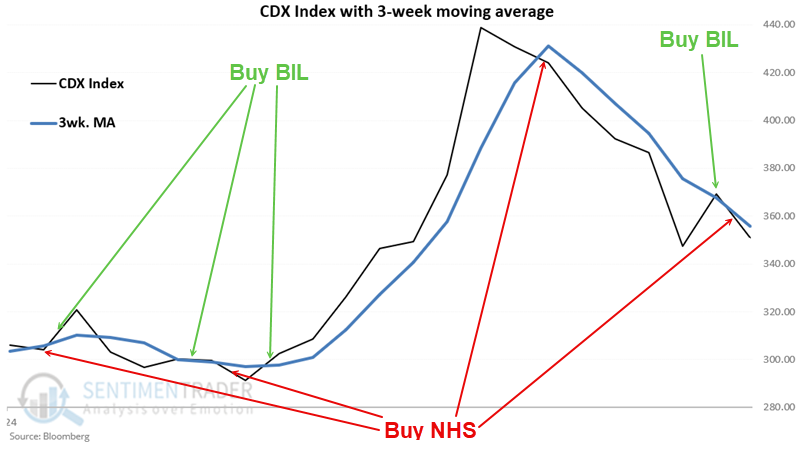
The chart above is a stark reminder that to adopt this strategy, an investor MUST be willing to pull the trigger and, at times, make frequent trades, occasionally switching into one security one week and into the other the following week.
What the research tells us…
Should income-oriented investors adopt the "Switch" strategy detailed above? Not necessarily. And certainly not without doing some due diligence to determine if this type of strategy is even appropriate for them. Please remember that the above switching strategy is presented as "food for thought" and not as a "one-size-fits-all" ready-to-go trading system. The key thing to consider is the sheer number of trades this strategy generates (almost 20 a year on average). Do you have the discipline required to follow the strategy successfully? Secondly, are you able to implement it in a non-taxable account? Remember that making roughly 20 trades a year means an endless slew of short-term capital gains, which would likely cut into long-term profitability. Also, remember that "high-yield securities" can entail significant volatility risk. Lastly comes the dreaded reminder that the results above are hypothetical and that "past performance does not guarantee future results."