
An uninterrupted selling cluster

Key points:
- There have now been 3 days with heavy down volume without an intervening day of heavy up volume
- This behavior is what many technicians like to believe happens during bear markets
- On the contrary, bear markets usually have more two-way volatility; behavior like this is more consistent with ongoing bull markets
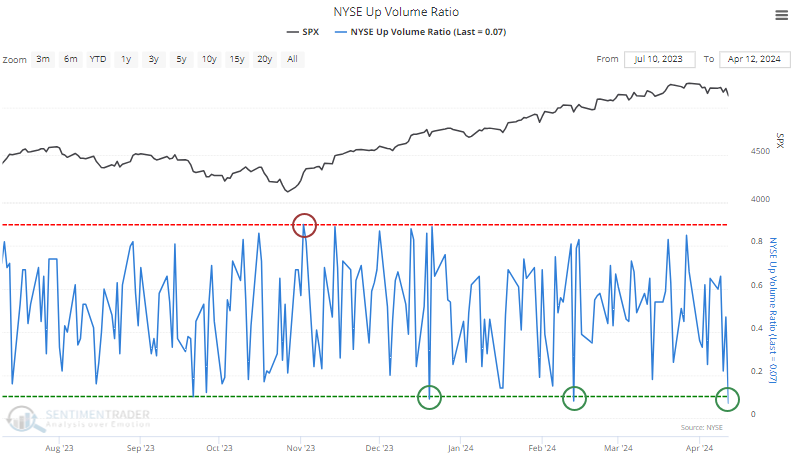
It's been months since a really good volume day
A well-worn heuristic among market technicians is that multiple days of heavy selling pressure with no intervening sessions of overwhelming buying interest is a terrible sign. It's a hallmark of bear markets, where only sellers are especially motivated.
That seems like it should be a concern now. Since the latest momentum push began last fall, there haven't been any days when more than 90% of NYSE volume flowed into advancing issues. But with Friday's session, there have now been three days with less than 10% advancing volume.
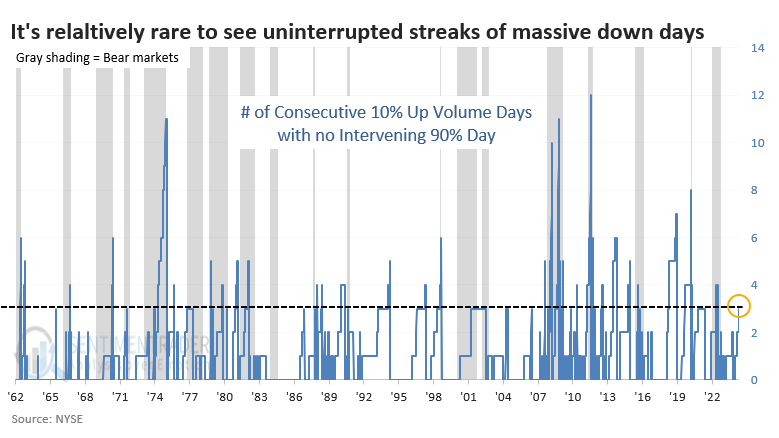
A string of at least three sessions of less than 10% up volume with no intervening reset above 90% isn't all that rare. Streaks tended to get extended during the worst bear markets, which makes sense.
Even during persistent bull markets, streaks of three or more frequently occurred. During some bear markets, streaks never got much beyond three days because conditions were volatile, and we would periodically see a 90% up day.
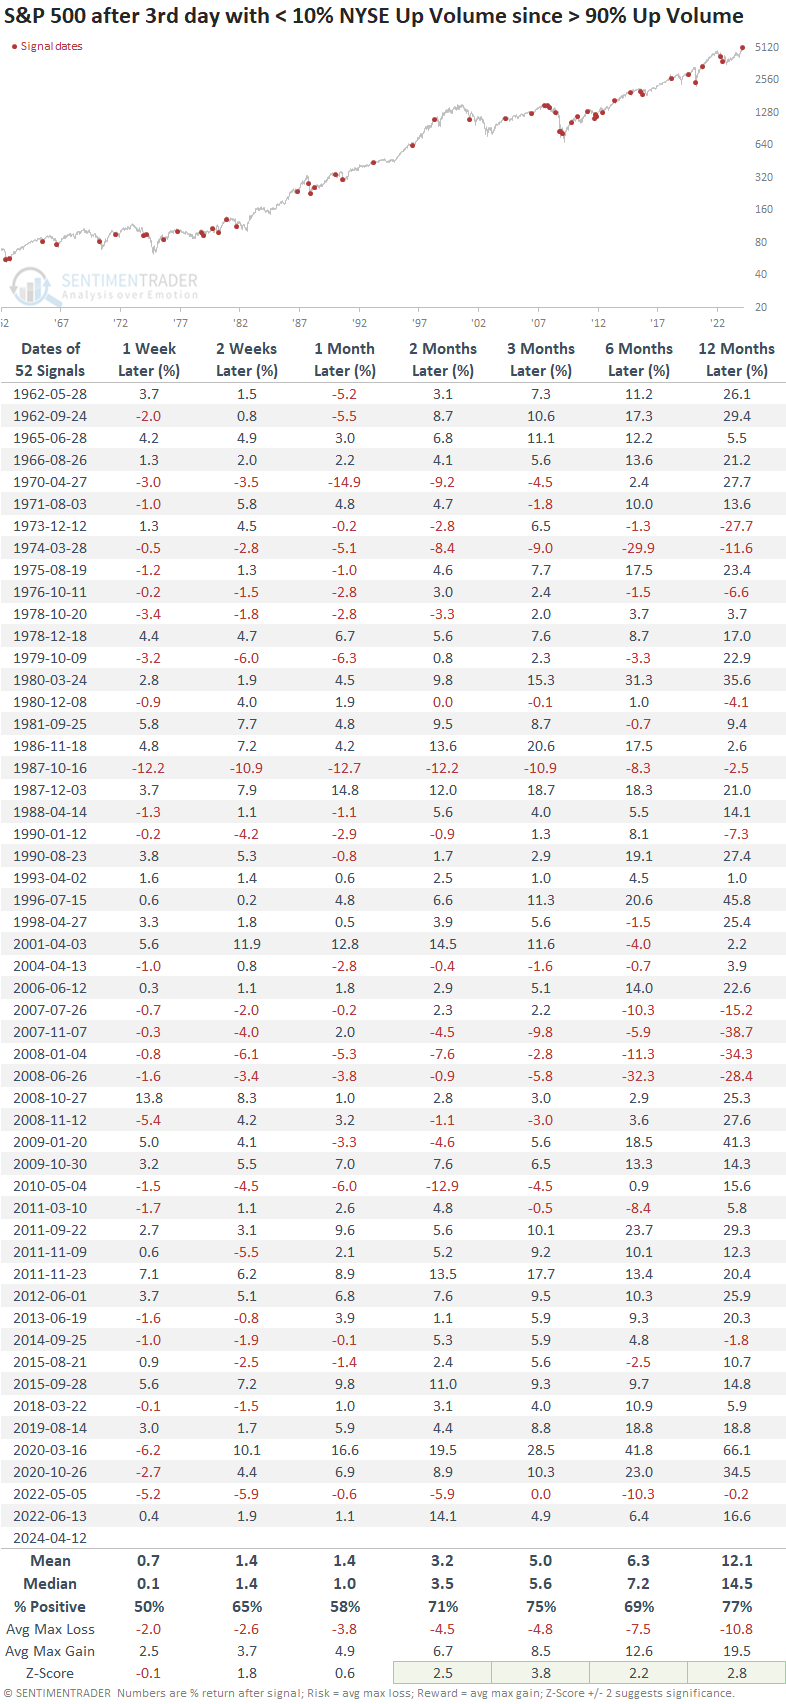
Uninterrupted selling clusters weren't so terrible
The table below shows all instances after the third session of less than 10% up volume on the NYSE with no intervening sessions of more than 90% up volume. There were many such examples, more than fifty, and returns in the S&P 500 weren't so dire, especially over the medium- to long-term.
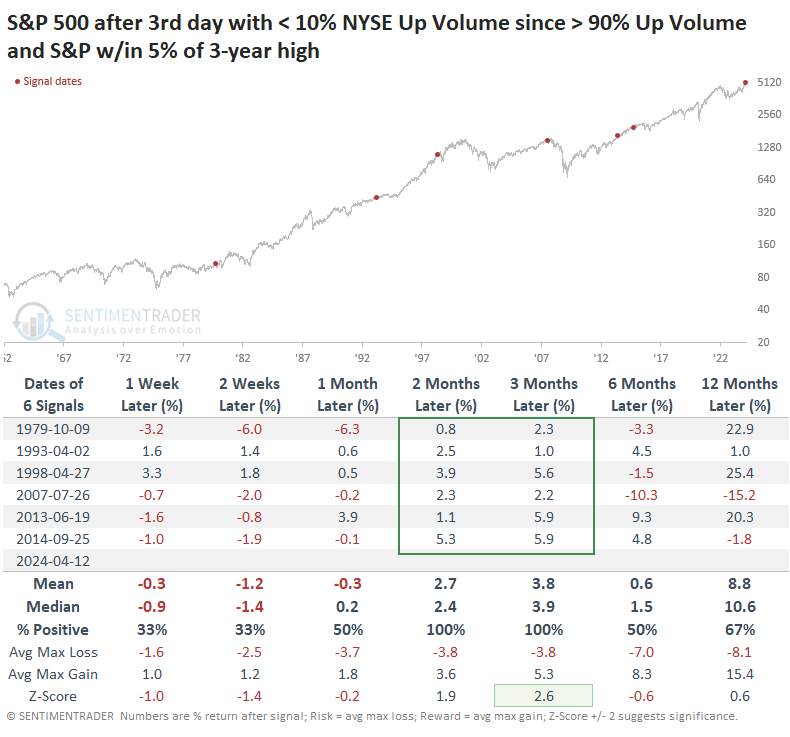
Perhaps some context might change the results. Most instances of such heavy down volume with no significant down volume occurred during ongoing bear markets. Very few of them were triggered when stocks were sitting near all-time highs.
The table below filters the signals to only include those when the S&P 500 was within 5% of a multi-year high at the time of the 3rd session of heavy selling pressure. There were only six other times this happened, and again, the results weren't so dire...for a while.
In the short-term, the S&P sold off or showed limited upside each time over the next 2-4 weeks. But from two to three months later, it rebounded every time, up nearly 4% on average-four of those then rolled over and showed losses six or twelve months later.
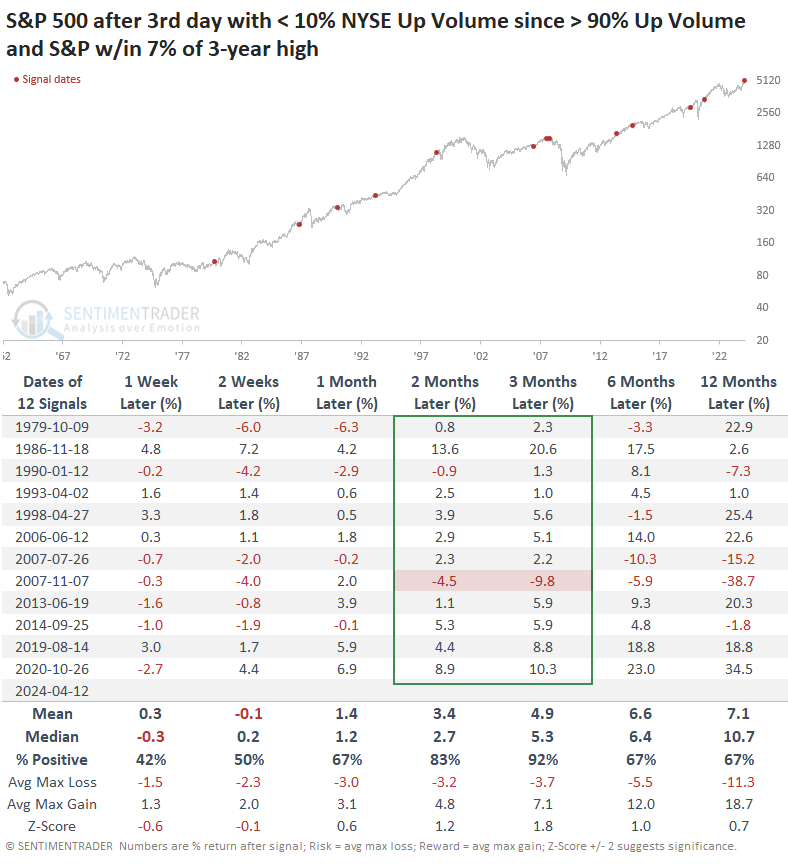
If we relax the threshold to the S&P being within 7% of a high, then we double the sample size. Again, short-term returns were relatively weak, but the risk/reward was heavily positive for stocks over the next two to three months. There was essentially only one failure near the peak before the global financial crisis.
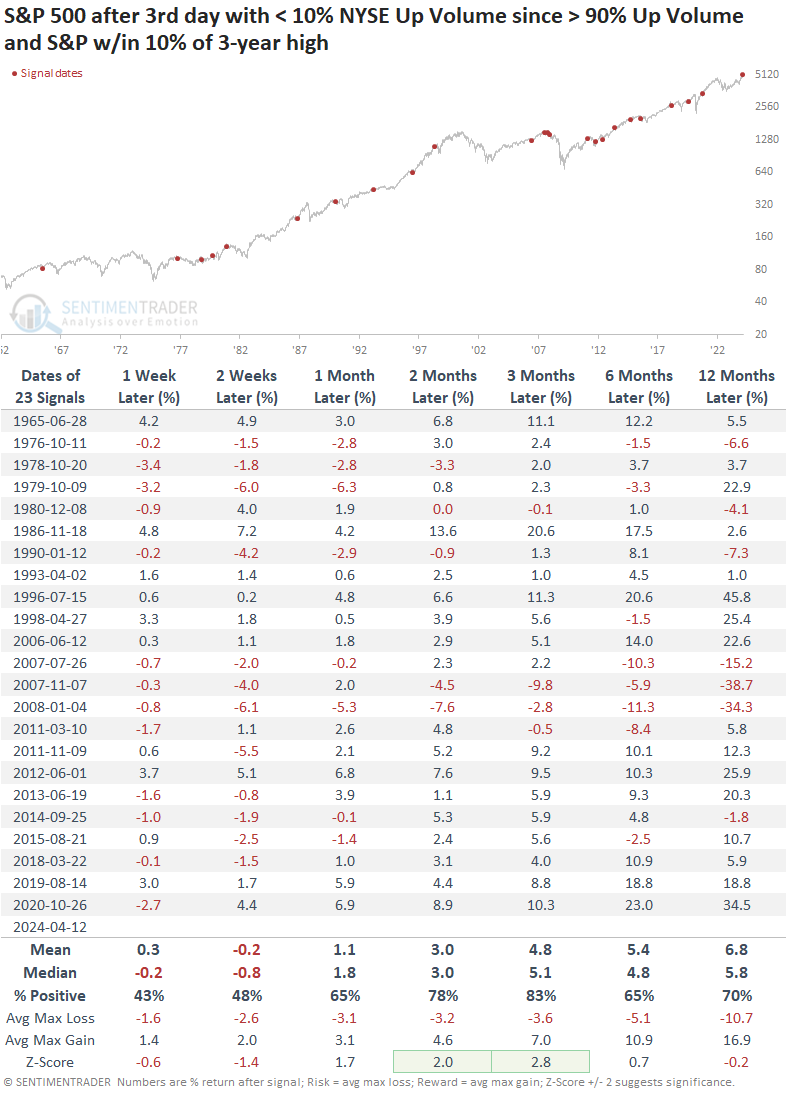
If we relax the parameters yet again, this time looking for signals when the S&P is still out of correction territory, the two- to three-month time frame continues to exhibit unusual strength after short-term weakness. Even though the sample size doubled again, the only true failure was near the peak in 2007-08.
What the research tells us...
A lot (a lot!) of rules-of-thumb take hold in markets. They start with a grain of truth and then get passed along through textbooks, conferences, newsletters, and social media. For some reason, investors tend to simply follow them and pass them along instead of taking the time to test their efficacy.
The heuristic of multiple 90% downside days without a 90% upside day is one of these rules that should be tested more than it has been. There are probably ways of torturing the data to come up with something negative, but the rule itself doesn't stand out as particularly problematic. That has especially been the case when these uninterrupted clusters of selling volume trigger after a period of relative stability. The financial crisis was a definite exception, but again, it was just that - an exception.