Products
SentimenTrader Trading Tools
‍
Backtest Engine
My Trading Toolkit
Correlation Analysis
Seasonality
Market Prediction
Indicators & Data API
‍
Proprietary Indicators & Charts
Market Data API
Strategies & Scanner
‍
50+ Trading Strategies
Smart Stock Scanner
Smart Option Scanner
Research Reports
‍
Research Solutions
Reports Library
Free Resources
Simple Backtest Calculator
Simple Seasonality Calculator
The Kelly Criterion Calculator
Sentiment Geo Map
Public Research Reports
Education
Sentiment Indicators
Technical Indicators
Pricing
Company
About
In the News
Testimonials
Client Success Stories
Contact
Log inLoginSign up
< BACK TO ALL REPORTS

An S&P 500 three month thrust

Jay Kaeppel
2024-02-02
The S&P 500 closed January with a massive three-month gain. Does this matter going forward? We look at some history to try to assess the future.

Key Points

  • Momentum is an important factor in the stock market
  • The S&P 500 Index closed January with a 3-month gain of +15.5%
  • In the last 70+ years, the market has shown a strong tendency to continue higher following thrusts of this magnitude

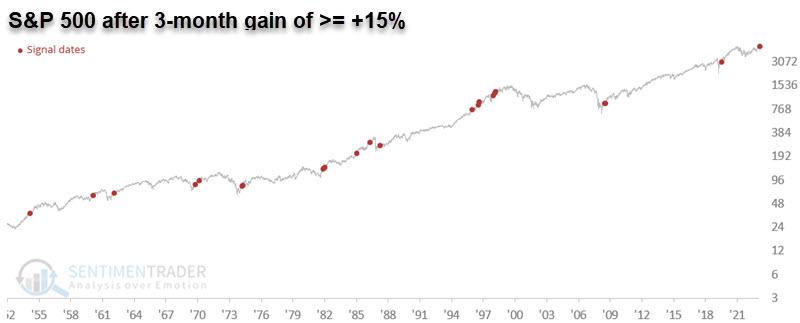
S&P 500 three months gain >= +15%

The S&P 500 closed January 2024 with a 3-month gain of +15.5%. Previous 3-month gains of 15% or more have tended to witness significant upside follow-through.

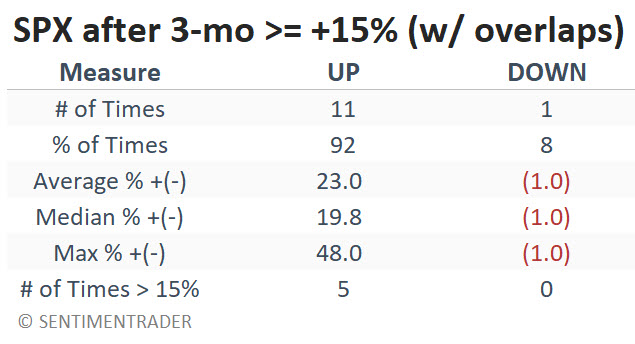
The table below displays all the months since 1955 when the S&P 500 registered a 3-month gain of +15% or more and subsequent S&P 500 performance. 

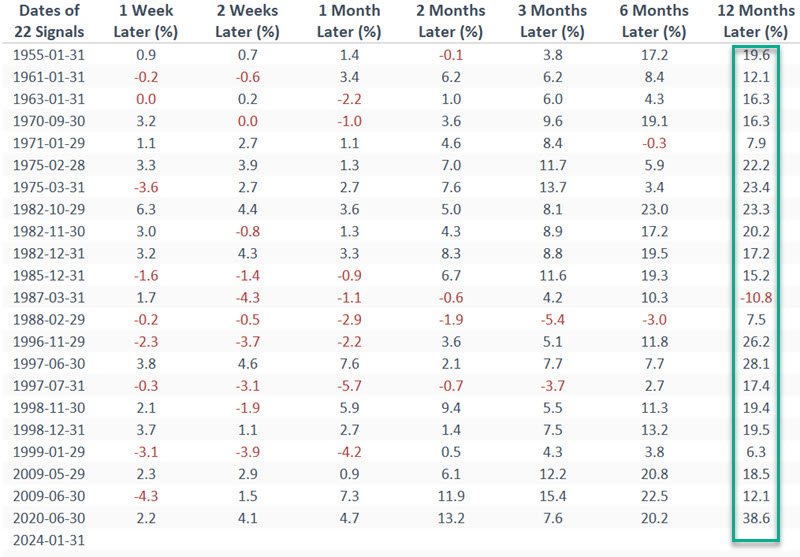
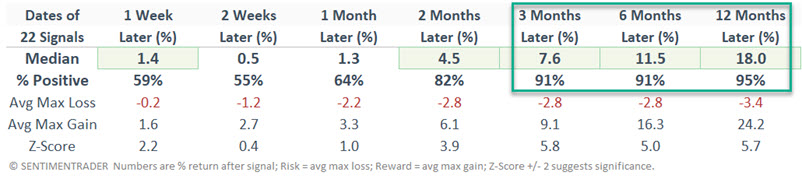
Note the high Win Rates - particularly for 3-months to 12-months - and the strong returns (12-month median return = +18%).

Given the new signal on 2024-01-31, does this mean "smooth sailing" for stocks in the year ahead? Not necessarily, but it does lend weight to the bullish side of the weight of the evidence ledger.

This signal as a trading model

It is not necessarily recommended that the indicator above be used as a standalone trading model. However, we will consider it as such to illustrate performance.

For our model, any new occurrence of a 3-month S&P 500 gain of +15% or more resets the counter to 12 months. For example, the signal on 2009-05-29 sets the counter to 12 months. The signal on 2009-06-30 resets the counter back to 12 months. So, barring any new signals, the holding period would be from 2009-05-29 through 2010-06-30 (i.e., 12 months after the last signal, or 13 months in total in this case).

To spell it out, the rules are simple:

  • If the S&P 500 Index closes a month with a 3-month gain of +15% or more, buy the S&P 500 Index
  • Hold the index fund for 12 months
  • If a new signal occurs within those 12 months, extend the holding period another 12 months
  • Sell the S&P 500 Index at the end of the holding period

The table below displays the S&P 500 performance using this model. The table shows the holding period length of each trade. Those with more than 12 months indicate that another signal occurred after the initial one.

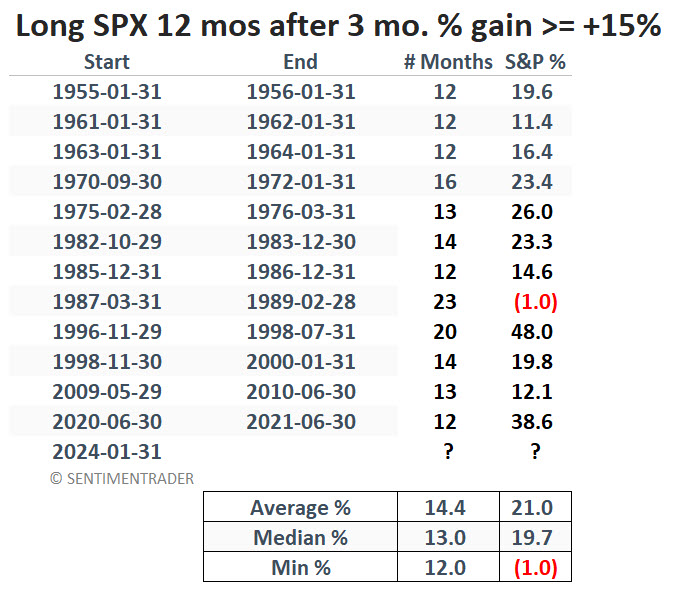
The chart below displays the growth of $1 invested in the S&P 500 during the periods listed in the table above.

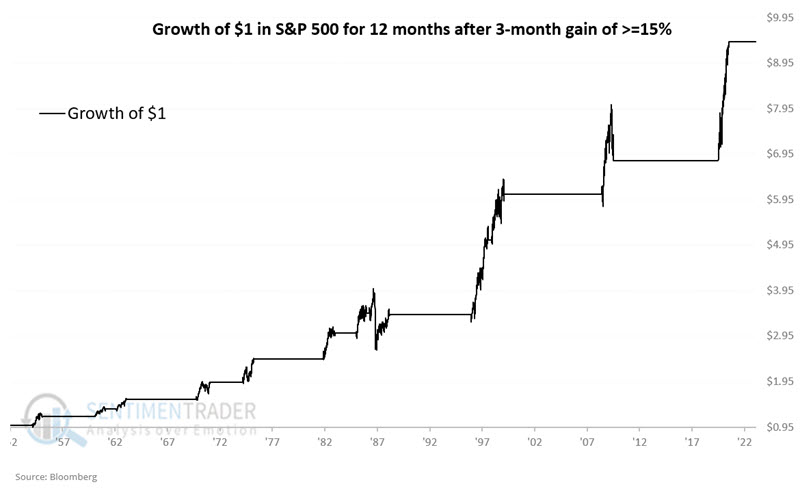
The table below summarizes S&P 500 performance during the periods shown above.

The results above are compelling, but it is important to remember that there is a difference between hypothetical backtests and actual trading. Note that the signal in March 1987 would have resulted in riding the 1987 decline and Crash all the way to the bottom (a -33.5% decline from peak to valley). So remember, there are no "magic" indicators - only weight of the evidence.

What the research tells us…

Thrust and momentum are essential factors in the stock market. Substantial gains often beget more gains as perceived market strength drives more investors to "take the plunge," and this new buying propels the market even higher. Since the 1950s, three-month gains of over +15% for the S&P 500 Index have typically been followed by additional gains in the year ahead. As 1987 proved, there are no guarantees despite a new favorable signal on the 2024-01-31 signal. But it does suggest continuing to give the bullish case the benefit of the doubt.

PRODUCTS
SentimenTrader
Trading Tools
Indicators & Data API
‍
Strategies & Scanner
‍
Research Reports
FREE
RESOUrCES
Simple Backtest
Calculator
Simple Seasonality
Calculator
The Kelly Criterion
Calculator
Sentiment Geo Map
‍
Public Research Reports
‍
Education
Sentiment Indicators
‍
Technical Indicators
‍
Pricing
Bundle pricing
‍
FAQ
‍
Announcements
‍
COMPANY
‍
About
‍
In the News
‍
Testimonials
‍
Client Success Stories
CONTACT
‍
General Inquiries
‍
Media Inquiries
‍
Financial Professionals Inquiries
‍
© 2026 Sundial Capital Research Inc. All rights reserved.
Setsail Marketing
TermsPrivacyAffiliate Program
Risk Disclosure: The information and tools provided are for research and analytical purposes only and are not intended as investment advice. Market analysis involves uncertainty, and outcomes may differ from expectations. Users should conduct their own due diligence and consider their individual circumstances before making any financial decisions. Past performance is not necessarily indicative of future results.

Hypothetical Performance Disclosure: Hypothetical performance results have many inherent limitations, some of which are described below. No representation is being made that any account will or is likely to achieve profits or losses similar to those shown; in fact, there are frequently sharp differences between hypothetical performance results and the actual results subsequently achieved by any particular trading program. One of the limitations of hypothetical performance results is that they are generally prepared with the benefit of hindsight. In addition, hypothetical trading does not involve financial risk, and no hypothetical trading record can completely account for the impact of financial risk of actual trading. for example, the ability to withstand losses or to adhere to a particular trading program in spite of trading losses are material points which can also adversely affect actual trading results. There are numerous other factors related to the markets in general or to the implementation of any specific trading program which cannot be fully accounted for in the preparation of hypothetical performance results and all which can adversely affect trading results.

Testimonial Disclosure: Testimonials appearing on this website may not be representative of other clients or customers and is not a guarantee of future performance or success.