
An S-TCTM Risk Warning Model member triggers a risk-off signal

Key points
- The percentage of S&P 500 components hitting 252-day lows spiked above 7.7% while the broader index remains near its highs.
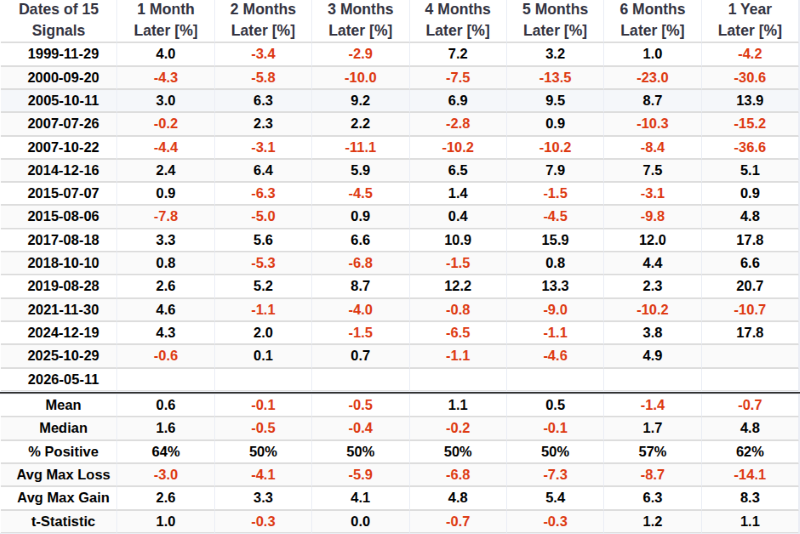
- Historically, this specific New Low Spike Model identifies a skewed risk profile where severe drawdowns outpace outsized gains, leading to sub-par forward returns over a 1-to-6-month window.
New Low Spike Model
As we've seen of late, a low level of new highs can signal internal rotation. It's not necessarily an outright negative for the market. While the percentage of new highs will almost always start to shrink and diverge from an index making new highs around inflection points, new lows are the most critical time series to monitor in a market uptrend. If an index is advancing and new lows are expanding, market breadth is unhealthy, and one should take note.
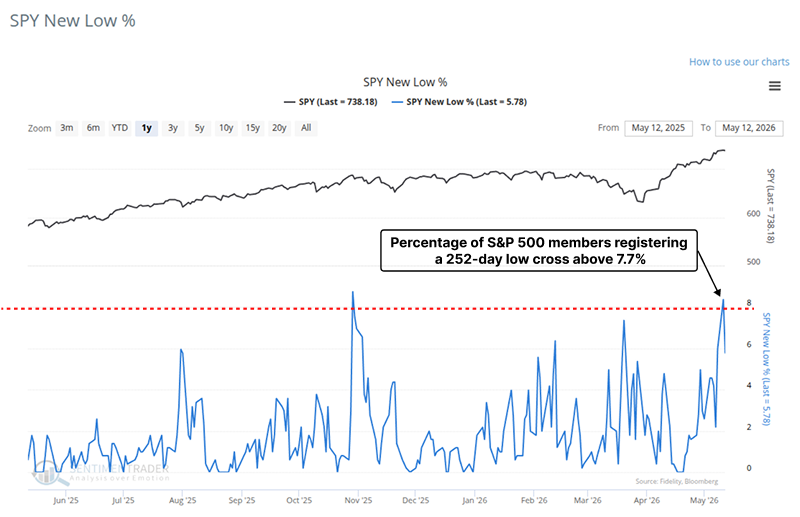
The New Low Spike Model utilizes the percentage of S&P 500 members registering a new 252-day low.
Signal Criteria
- Condition 1 = The percentage of S&P 500 members with a 252-day low crosses above 7.7%.
- Condition 2 = The S&P 500 is less than 5% from its 252-day high.
- Condition 3 = The percentage of S&P 500 252-day lows resets below 0.5%. This reset filters out repetitive signals.
- Condition 4 = If Conditions 1-3 are met, a risk-off signal is issued.
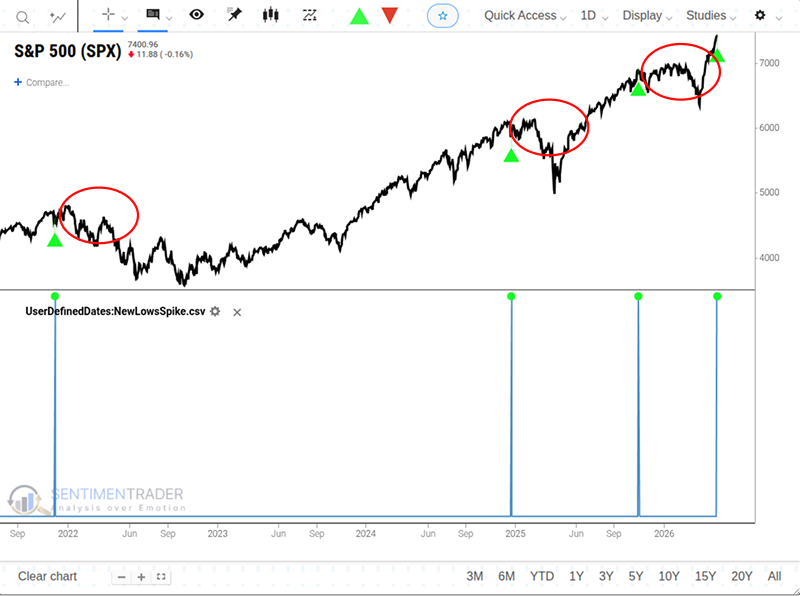
An Expanding Trend in New Lows Often Precedes Negative Forward Returns
When the percentage of S&P 500 constituents registering 252-day lows spikes above the 7.7% threshold while the index itself hovers near 252-day highs, the world's most benchmarked index typically suffers negative forward returns and unfavorable win rates. While the S&P 500 ultimately tends to recover, its expected performance over the subsequent one-to-six-month window noticeably lags behind historical baseline trends.
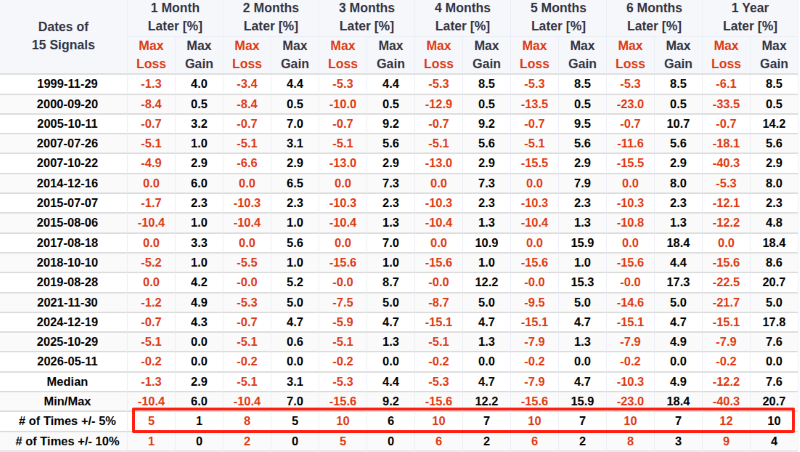
Across all measured time horizons, the frequency of maximum drawdowns exceeding 5% consistently outpaces the occurrence of maximum gains greater than 5%. This specific risk profile indicates a highly elevated probability of a near-term correction for the S&P 500.
A single arrow is easily broken, but not ten in a bundle
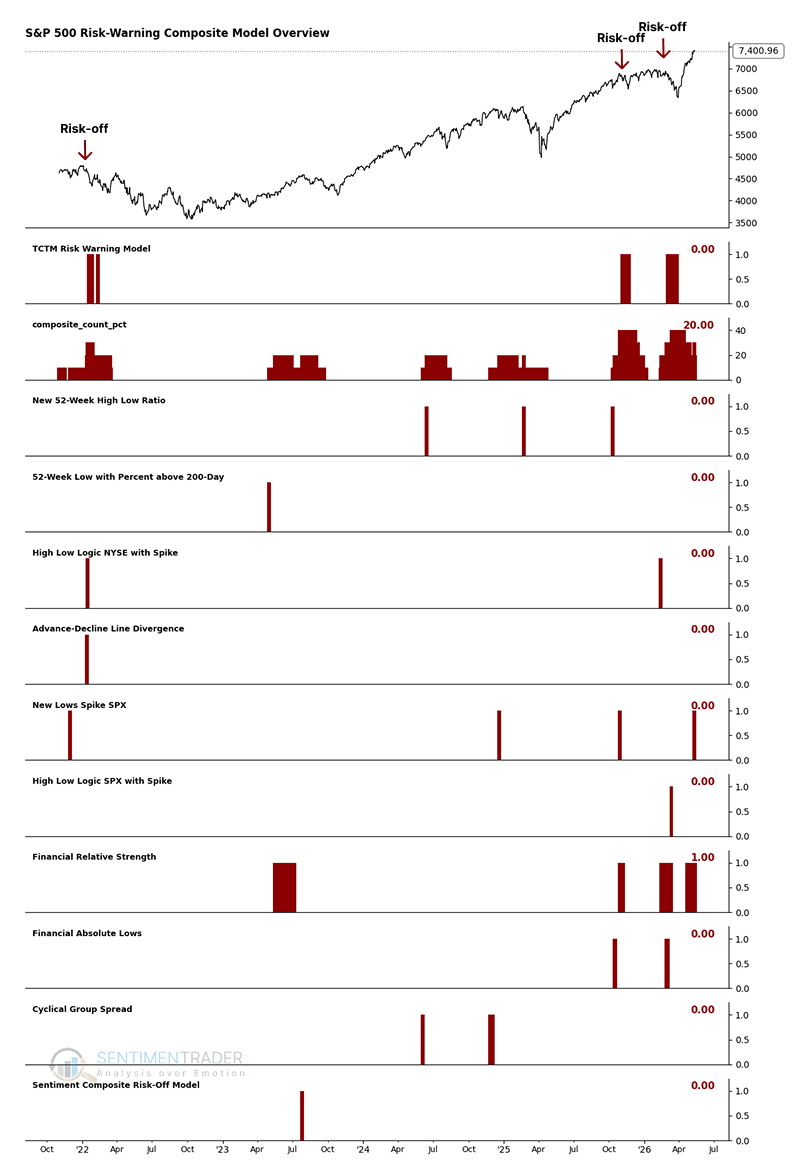
For the broader Composite Risk Warning Model to issue a formal alert, the composite signal count must reach a threshold of at least 30%, AND the S&P 500's 5-day rate of change must be -1% or worse within a 20-day window. Currently, this overarching condition has not been met.
It is common for the signal count to increase without reaching the trigger threshold for the composite model. Typically, this denotes sector rotation rather than systemic failure.
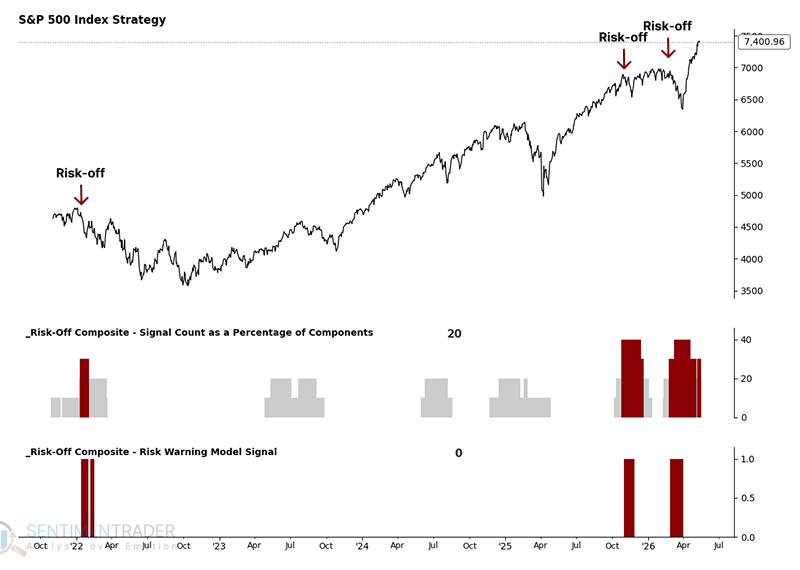
Below are the details of the components within this composite.
A secondary risk-off composite
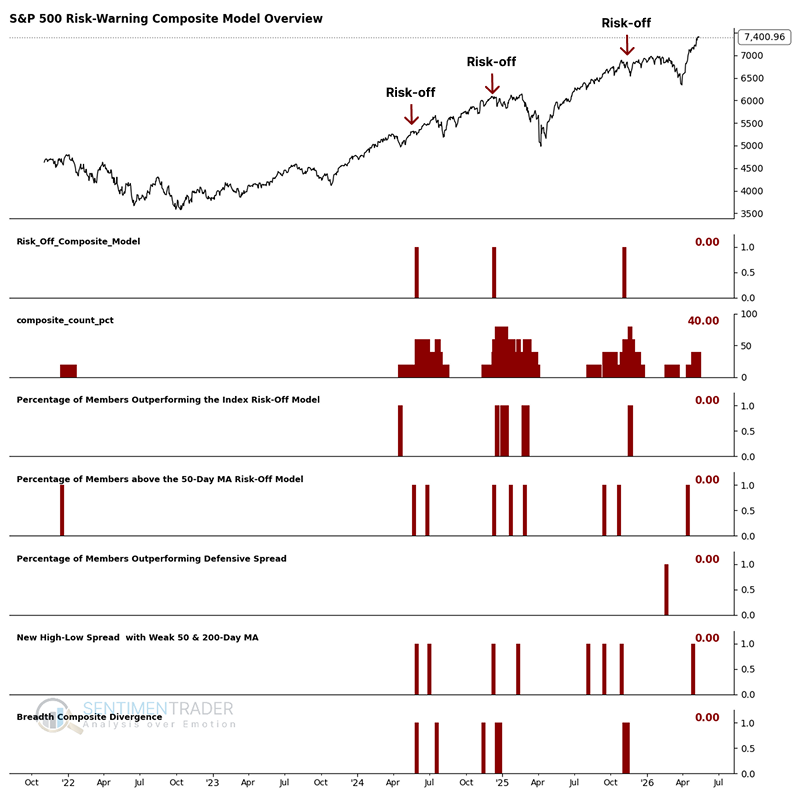
The Risk-Off Composite Model is not a primary component of the S-TCTM; it can be found at the bottom of the S-TCTM Live website page. We utilize it as a secondary risk management measure.
This model currently shows a signal count of 40%, indicating that breadth-based warnings have not yet reached the threshold necessary to trigger a formal alert.
What the research tells us...
Monitoring internal market breadth, particularly the expansion of new lows during a rising tape, is critical for identifying structural divergences. A new alert from a S-TCTM Composite Risk Warning Model member, which monitors new lows, suggests risks are rising. Once again, the values in the table above do not scream "Sell everything!". However, they do raise an important point: investors should be vigilant about the possibility of a market correction and adjust their asset allocation accordingly.