Indicators &
Backtest Tools
Research
Reports
Report Solutions
Reports Library
Strategies
& Scanner
Free
Resources
Simple Backtest Calculator
Simple Seasonality Calculator
The Kelly Criterion Calculator
Sentiment Geo Map
Public Research Reports
Free Webinar
Pricing
Company
About
Meet Our Team
In the News
Testimonials
Client Success Stories
Contact
Log inLoginSign up
< BACK TO ALL REPORTS

An overwhelming number of buy signals

Jason Goepfert
2020-04-14
More and more stocks within the S&P 500 have triggered buy signals using a Point & Figure methodology. This follows a period when almost all of the stocks had been on sell signals. When this measure moves from a deep oversold to deep overbought reading, it has only triggered at important inflection points.

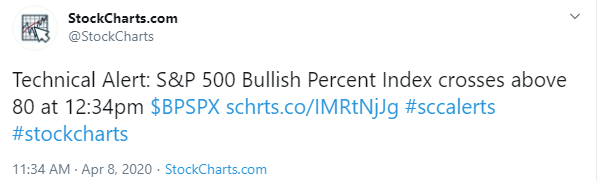
According to a popular charting service, a huge number of stocks within the S&P 500 have flipped to buy signals.

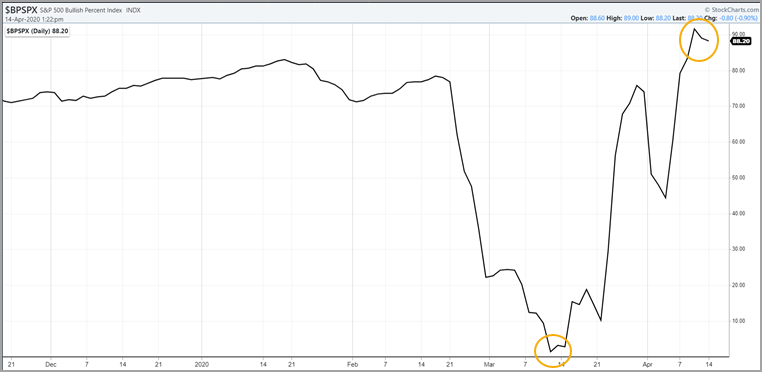
The indicator measures how many stocks within the index are currently on buy signals. A buy signal is given when the Point & Figure chart is showing an uptrend.

According to Investopedia:

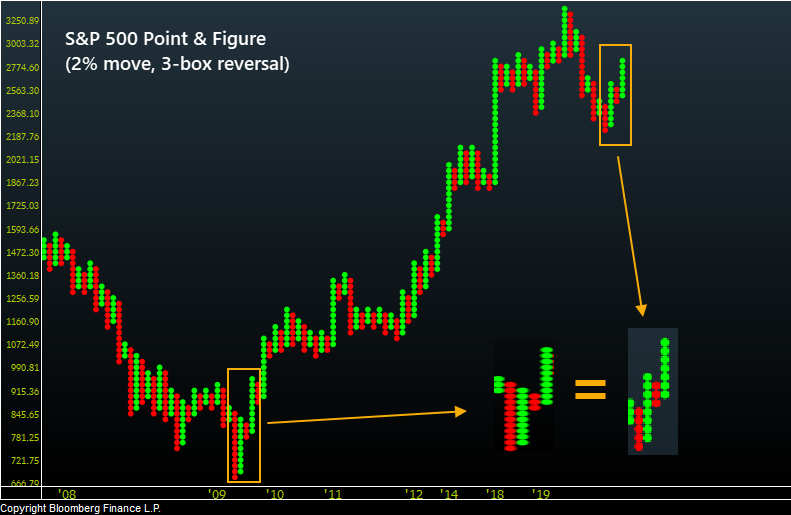
Contrary to some other types of charts, like candlesticks, which mark the degree of an asset's movement over set time periods, P&F charts utilize columns consisting of stacked Xs or Os, each of which represents a set amount of price movement. The Xs illustrate rising prices, while Os represent a falling price.

Technicians use P&F charts in various ways, from simple reversals to trendline analysis to pattern recognition. For example, the P&F pattern carved out in recent months is very close to what happened from January through June 2009.

The reason this is getting attention now is because almost all stocks within the S&P 500 were on sell signals in March, and in recent sessions most of them have flipped to buy signals, as noted by StockCharts.

To say this is unusual is an understatement. Going back to 1996, it's only occurred 3 other times, and their implications were consistent.

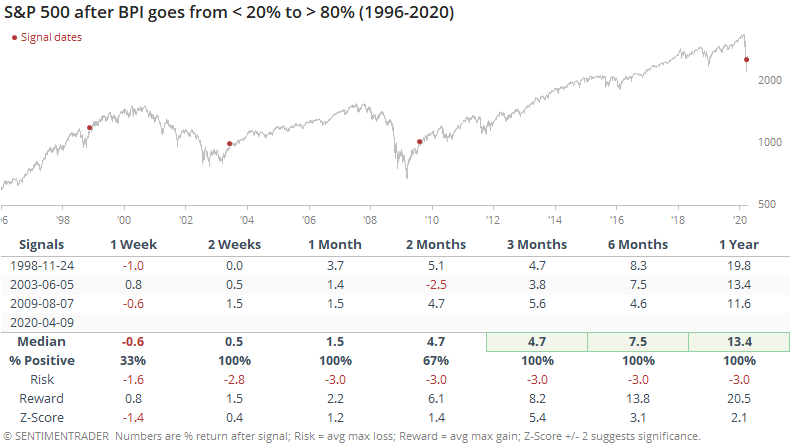
While all of them saw a period of consolidation after the surge in P&F buy signals, at least over the next week or two, they all resumed their march higher in the months ahead.

The risk/reward table was impressive as well.

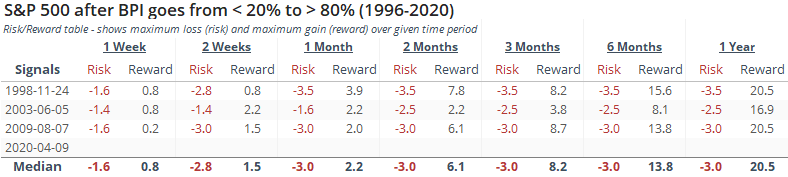
Even though these signals triggered during (or more accurately, after) a few of the most volatile stretches in 25 years, maximum losses over the next year were limited to -3.5%, while maximum gains were all in the double digits.

If we relax the parameters to get a larger sample size, the returns were not robust. The table was filled with at least temporary failures as these lesser extremes led to a quick resumption of the downtrend.

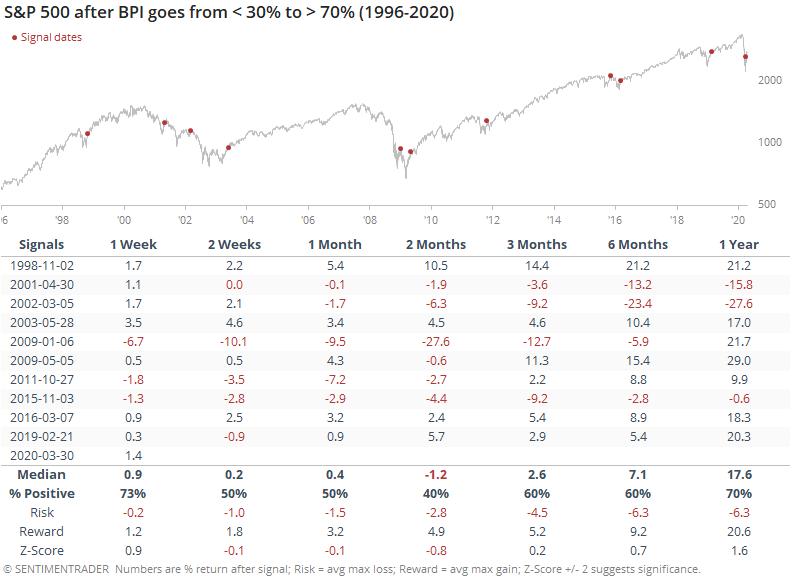
So the big question is whether we can rely on the tiny sample size based off an obscure indicator. Not really - we certainly wouldn't put a lot of weight on it.

But it's at least interesting to note that an overwhelming percentage of stocks have reversed enough on a percentage basis to trigger these buy signals, and every time it's cycled from so many sell signals to so many buys, it has coincided with important inflection points.

Sorry, you don't have access to this report

Upgrade your subscription plan to get access
Go to Dasboard
Indicators & Backtest Tools
IndicatorEdge
‍
BackTestEdge
‍
Other Tools
‍
DataEdge API
RESEARCH
reports
Research Solution
‍
Reports Library
‍
Strategies & Scanner
Trading Strategies
‍
Smart Stock Scanner
‍
FREE
RESOUrCES
Simple Backtest
Calculator
Simple Seasonality
Calculator
The Kelly Criterion
Calculator
Sentiment Geo Map
‍
Public Research Reports
‍
Free Webinar
COMPANY
‍
About
‍
Meet our Team
‍
In the News
‍
Testimonials
‍
Client Success Stories
Pricing
Bundle pricing
‍
Announcements
‍
FAQ
© 2024 Sundial Capital Research Inc. All rights reserved.
Setsail Marketing
TermsPrivacyAffiliate Program
Risk Disclosure: Futures and forex trading contains substantial risk and is not for every investor. An investor could potentially lose all or more than the initial investment. Risk capital is money that can be lost without jeopardizing ones’ financial security or life style. Only risk capital should be used for trading and only those with sufficient risk capital should consider trading. Past performance is not necessarily indicative of future results.

Hypothetical Performance Disclosure: Hypothetical performance results have many inherent limitations, some of which are described below. No representation is being made that any account will or is likely to achieve profits or losses similar to those shown; in fact, there are frequently sharp differences between hypothetical performance results and the actual results subsequently achieved by any particular trading program. One of the limitations of hypothetical performance results is that they are generally prepared with the benefit of hindsight. In addition, hypothetical trading does not involve financial risk, and no hypothetical trading record can completely account for the impact of financial risk of actual trading. for example, the ability to withstand losses or to adhere to a particular trading program in spite of trading losses are material points which can also adversely affect actual trading results. There are numerous other factors related to the markets in general or to the implementation of any specific trading program which cannot be fully accounted for in the preparation of hypothetical performance results and all which can adversely affect trading results.

Testimonial Disclosure: Testimonials appearing on this website may not be representative of other clients or customers and is not a guarantee of future performance or success.