Data &
Technology
Research
Reports
Report Solutions
Reports Library
Actionable
Strategies
Free
Resources
Simple Backtest Calculator
Simple Seasonality Calculator
The Kelly Criterion Calculator
Sentiment Geo Map
Public Research Reports
Free Webinar
Pricing
Company
About
Meet Our Team
In the News
Testimonials
Client Success Stories
Contact
Log inLoginSign up
< BACK TO ALL REPORTS

An overbought condition with bullish implications for the stock market

Dean Christians
2022-08-02
The percentage of S&P 500 issues with a 14-day stochastic oscillator greater than 80% surged above 71, triggering an alert for a model with a 75% win rate. The algorithm is a component in the TCTM composite thrust model.

Key points:

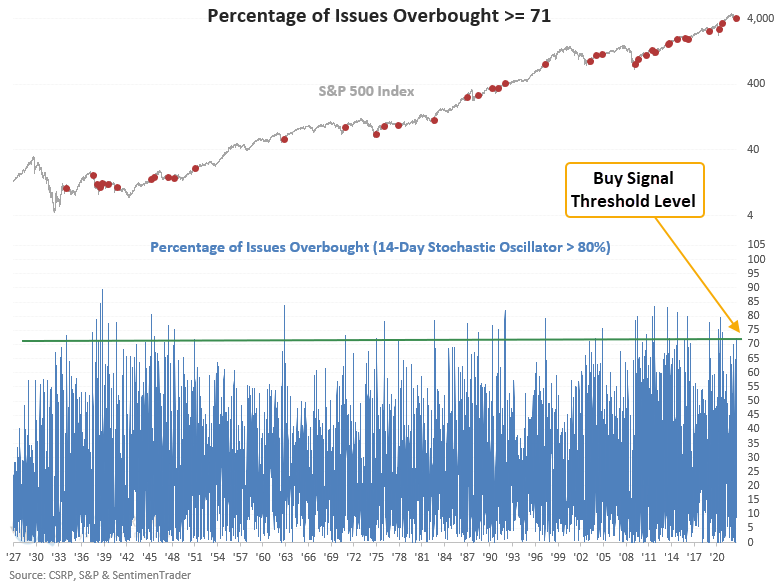
  • The percentage of S&P 500 issues with a 14-day stochastic oscillator above 80% surged to 71
  • The surge in participation triggered a new TCTM composite thrust model signal
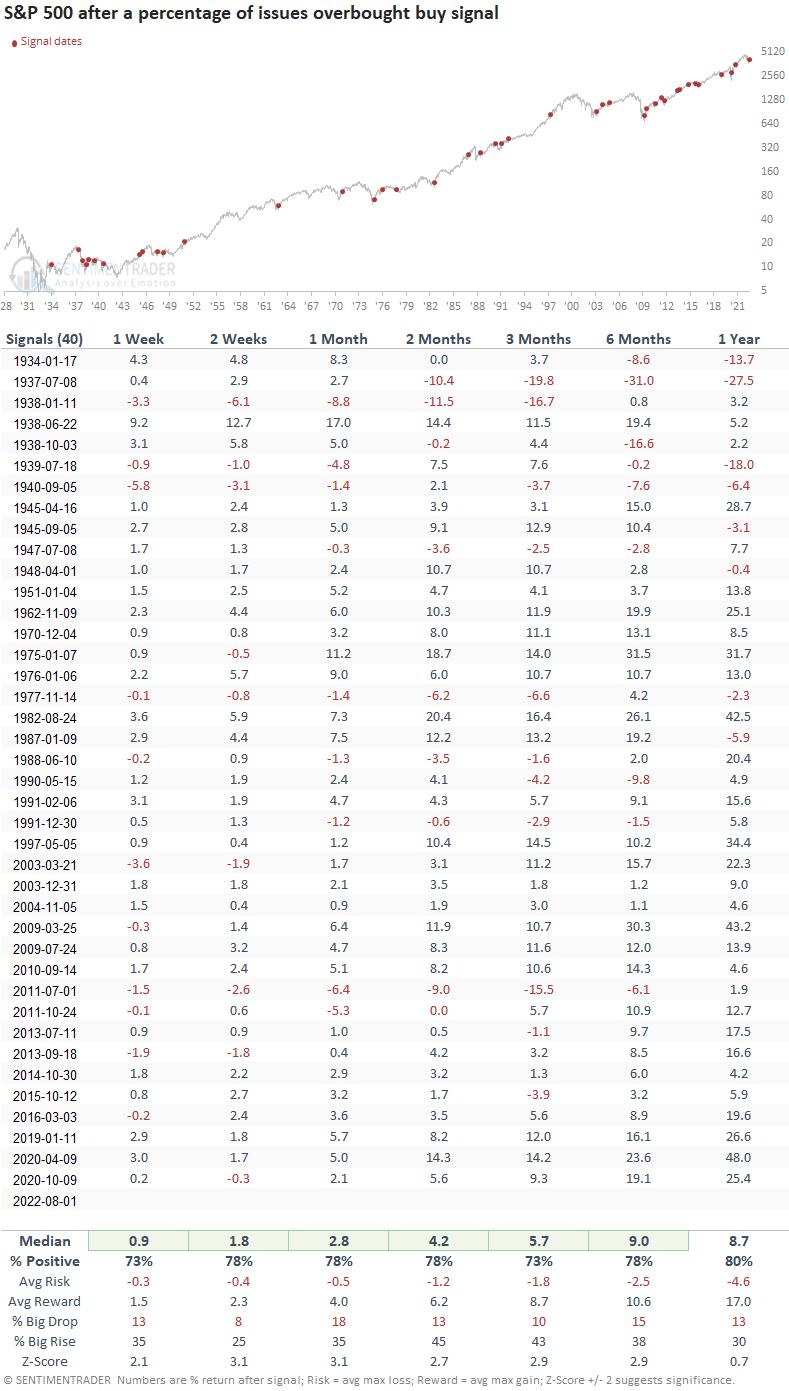
  • After other signals, the S&P 500 rallied 80% of the time over the next 12 months
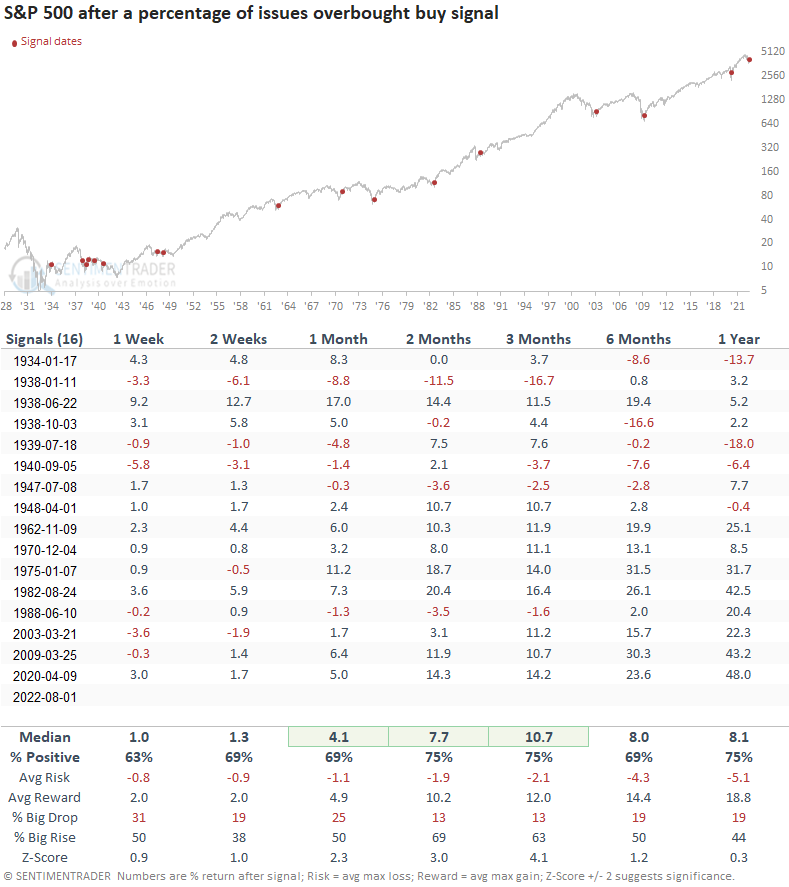
  • If I isolate bear market instances, the S&P 500 rallied 75% of the time over the next 12 months

A good overbought condition represents market momentum with bullish implications

A new signal from a voting member in the TCTM Composite Thrust Model issued an alert at the close of trading on Monday. The component is called the percentage of issues overbought model.

The model uses the stochastic oscillator, a technical indicator that measures momentum by comparing the current closing price to the high and low price over a lookback period. The standard setting is 14 days, and the oscillator ranges from 0% lowest to 100% highest.

The algorithm identifies when the percentage of S&P 500 issues with a 14-day stochastic oscillator above 80% reaches 71. I screened out repeats by pinpointing the first occurrence in 42 days and with a reset that requires the value to fall below 20.

Similar signals preceded gains 80% of the time a year later

This model generated a signal 40 other times over the past 88 years. After the others, S&P 500 future returns, win rates, and z-scores were excellent across almost all time frames. The signal shows a gain at some point in the first 2 months in 37 out of 40 instances.

Signals associated with a bear market

If I isolate instances after the S&P 500 closed down 20%, the model generated a signal 16 other times in the last 88 years. After the others, S&P 500 future returns, win rates, and z-scores were solid across almost all time frames. Since 1950, the alert shows a perfect record 6 and 12 months later.

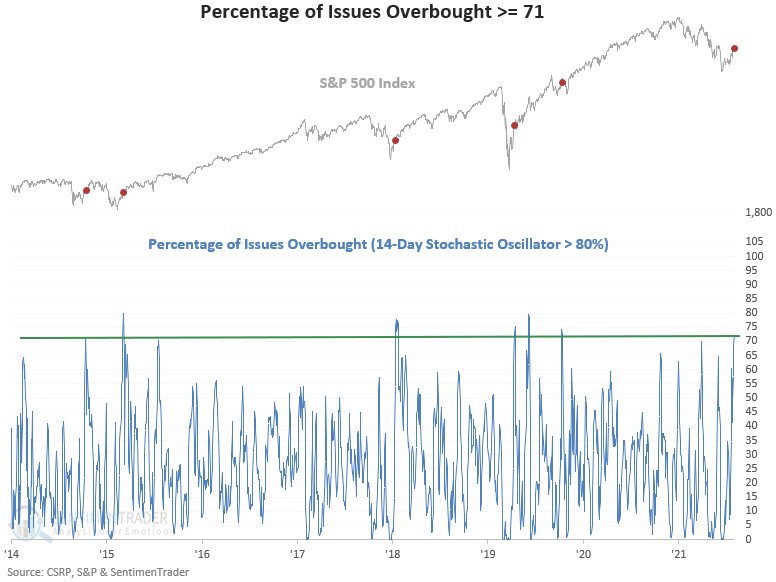
Let's zoom in and review some of the signals/charts since 1973. 

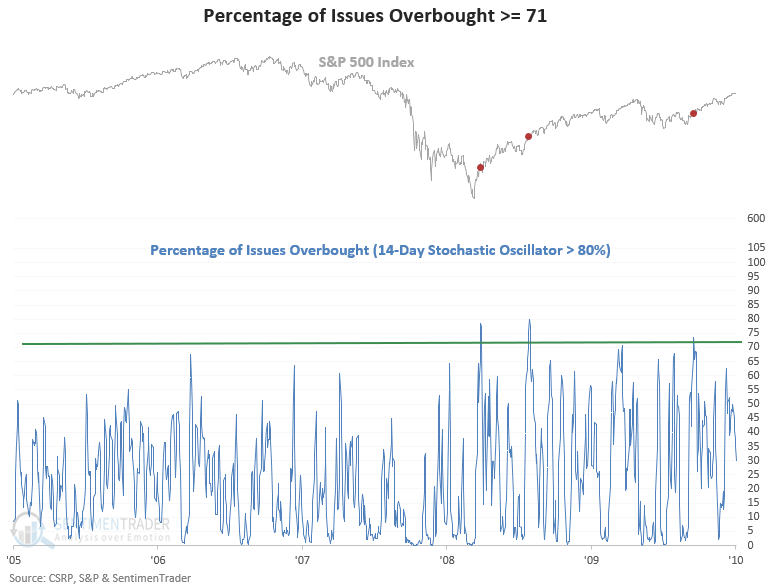
Current day chart example

2007-08 chart example

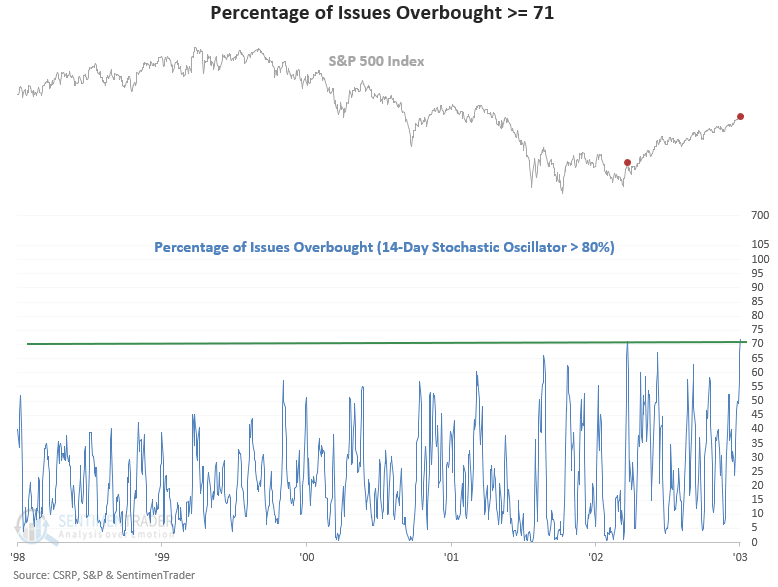
2000-02 chart example

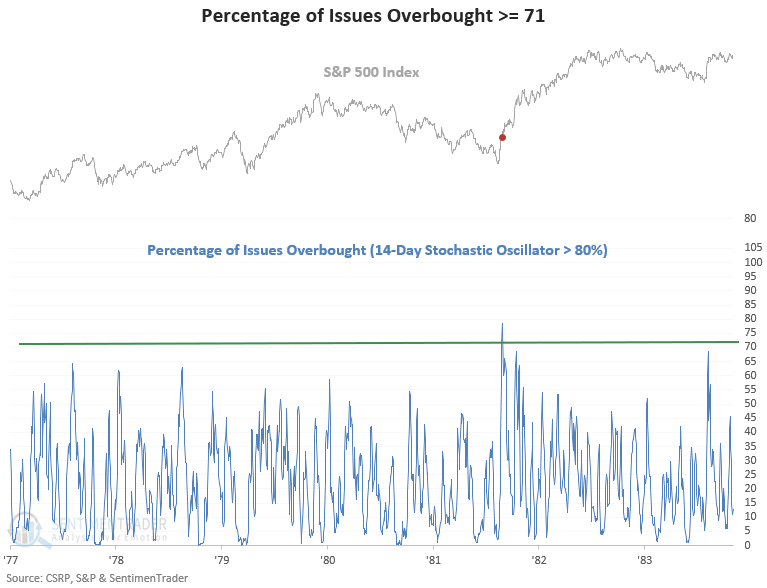
1980-82 chart example

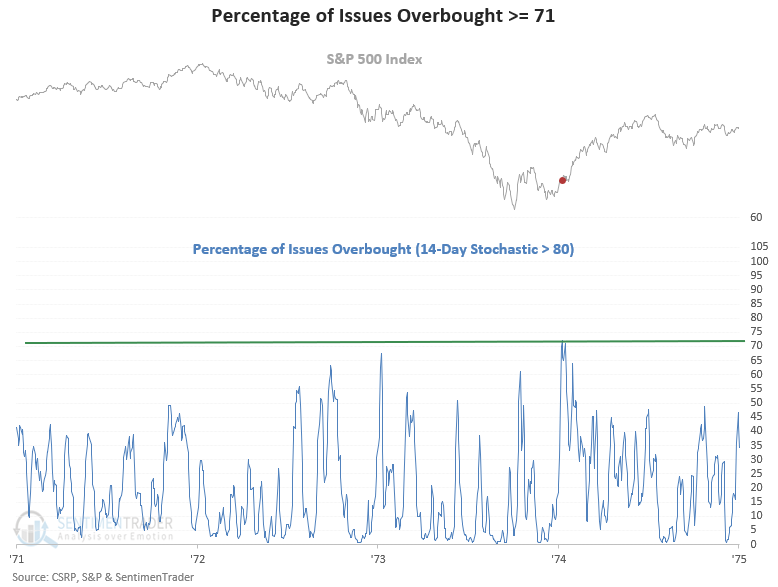
1973-74 chart example

What the research tells us...

When the percentage of issues with an overbought stochastic oscillator surges to 71, the burst in participation amongst index members typically leads to further positive price momentum for the S&P 500. Similar setups to what we're seeing now have preceded solid returns, win rates, and z-scores across almost all time frames.

Sorry, you don't have access to this report

Upgrade your subscription plan to get access
Go to Dasboard
DATA &
TECHnologies
IndicatorEdge
‍
BackTestEdge
‍
Other Tools
‍
DataEdge API
RESEARCH
reports
Research Solution
‍
Reports Library
‍
actionable
Strategies
Trading Strategies
‍
Smart Stock Scanner
‍
FREE
RESOUrCES
Simple Backtest
Calculator
Simple Seasonality
Calculator
The Kelly Criterion
Calculator
Sentiment Geo Map
‍
Public Research Reports
‍
Free Webinar
COMPANY
‍
About
‍
Meet our Team
‍
In the News
‍
Testimonials
‍
Client Success Stories
Pricing
Bundle pricing
‍
Announcements
‍
FAQ
© 2024 Sundial Capital Research Inc. All rights reserved.
Setsail Marketing
TermsPrivacyAffiliate Program
Risk Disclosure: Futures and forex trading contains substantial risk and is not for every investor. An investor could potentially lose all or more than the initial investment. Risk capital is money that can be lost without jeopardizing ones’ financial security or life style. Only risk capital should be used for trading and only those with sufficient risk capital should consider trading. Past performance is not necessarily indicative of future results.

Hypothetical Performance Disclosure: Hypothetical performance results have many inherent limitations, some of which are described below. No representation is being made that any account will or is likely to achieve profits or losses similar to those shown; in fact, there are frequently sharp differences between hypothetical performance results and the actual results subsequently achieved by any particular trading program. One of the limitations of hypothetical performance results is that they are generally prepared with the benefit of hindsight. In addition, hypothetical trading does not involve financial risk, and no hypothetical trading record can completely account for the impact of financial risk of actual trading. for example, the ability to withstand losses or to adhere to a particular trading program in spite of trading losses are material points which can also adversely affect actual trading results. There are numerous other factors related to the markets in general or to the implementation of any specific trading program which cannot be fully accounted for in the preparation of hypothetical performance results and all which can adversely affect trading results.

Testimonial Disclosure: Testimonials appearing on this website may not be representative of other clients or customers and is not a guarantee of future performance or success.