
An opportunity may finally be forming in beaten down materials

Key points
- The Materials sector has experienced significant weakness relative to the overall market
- On a trend-following basis, the sector is in the throes of a steep decline, and seasonality is weak for several more weeks
- On the plus side, several reliable indicators are suggesting better days ahead for this downtrodden sector
The fly in the ointment
There are two questions regarding the Materials sector. The first is, "Are better days ahead for this beaten-down sector?" As we will highlight shortly, there is a compelling argument to answer that question with a "Yes." However, the second question is, "Is this the time to buy?" That is a more difficult question to answer.
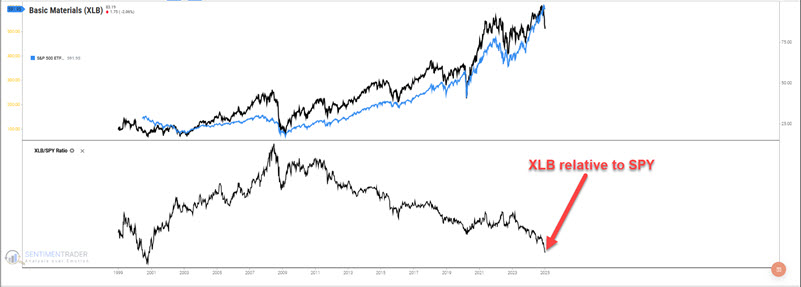
To gain some long-term perspective, the chart below displays the performance of the iShares Materials sector ETF (ticker XLB) relative to the S&P 500 index, which is tracked by ticker SPY. As you can see in the bottom clip, XLB's performance relative to SPY's has plunged to a multi-year low.
Buying into a sharp decline can provide maximum opportunity if a sharp rebound unfolds. On the other hand, this action can also end up more like trying "to catch a falling safe."
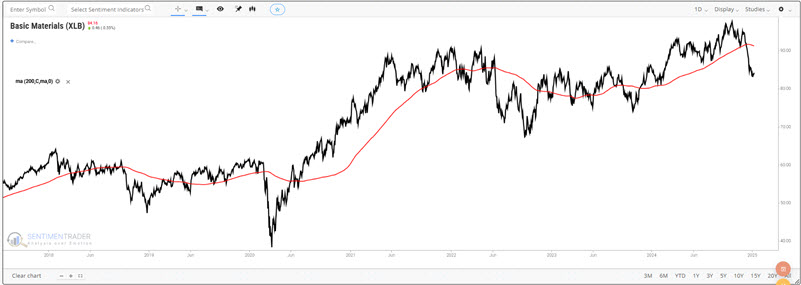
The chart below shows that the iShares Materials sector ETF (ticker XLB) has recently plunged well below its 200-day moving average. Objectively speaking, this can be defined as a downtrend, and there is risk involved in buying into the teeth of a downtrend. That said, the indicators detailed below suggest that - at the very least - investors should have the materials sector on their radar and be looking for a buying opportunity.
XLB % Below Bband
The chart below highlights with a red dot each day when the percentage of XLB constituent stocks trading below the respective lower Bollinger Band crossed above 78%, including overlaps. The most recent signal occurred on 2024-12-18.

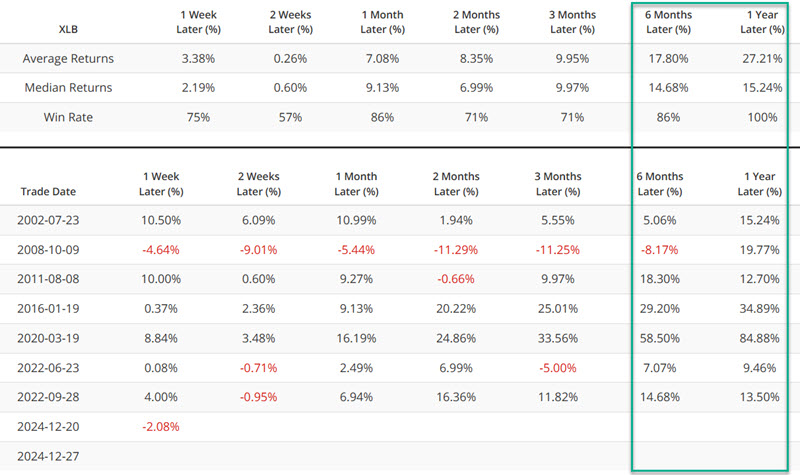
The table below displays signal-by-signal results for all signals since 1998 and summarizes XLB performance.
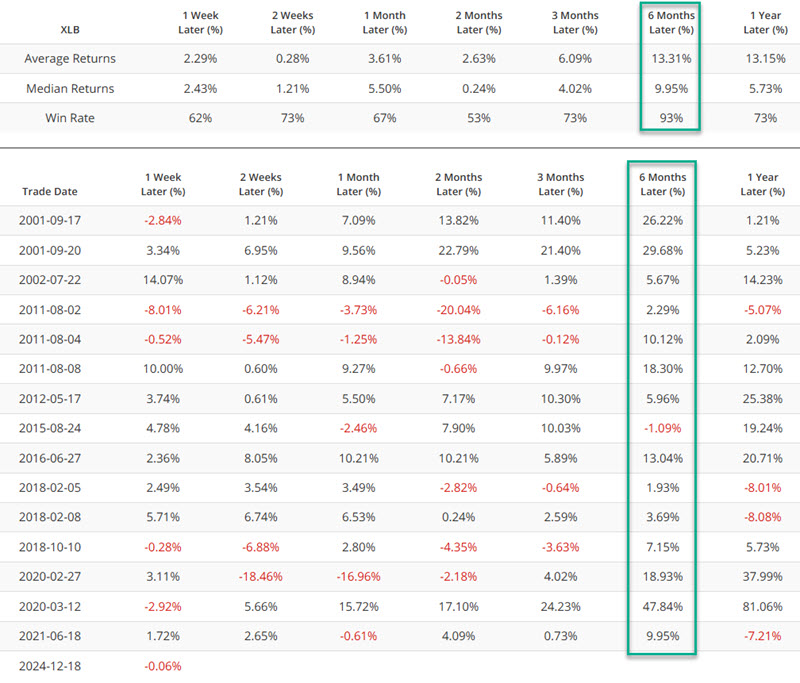
The six-month timeframe appears to be the sweet spot for this signal.
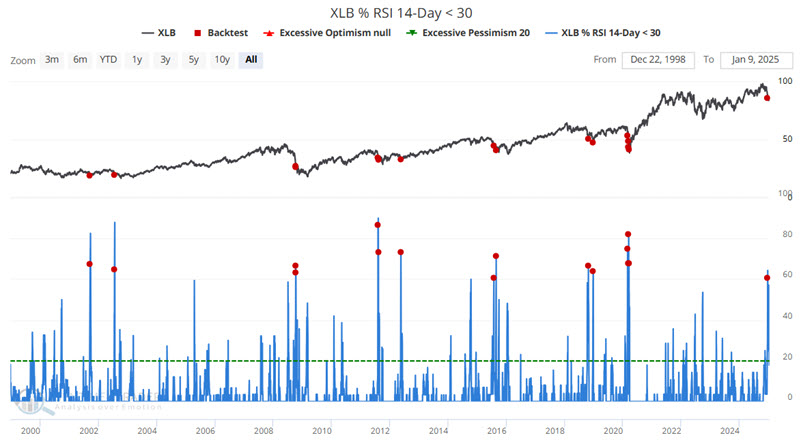
% of XLB stocks with 14-day RSI < 30%
The chart below highlights with a red dot each day when the percentage of XLB constituent stocks with a 14-day RSI below 30 crossed above 60%, including overlaps. The most recent signal occurred on 2024-12-18.
The table below displays signal-by-signal results for all signals since 1998 and summarizes XLB performance.
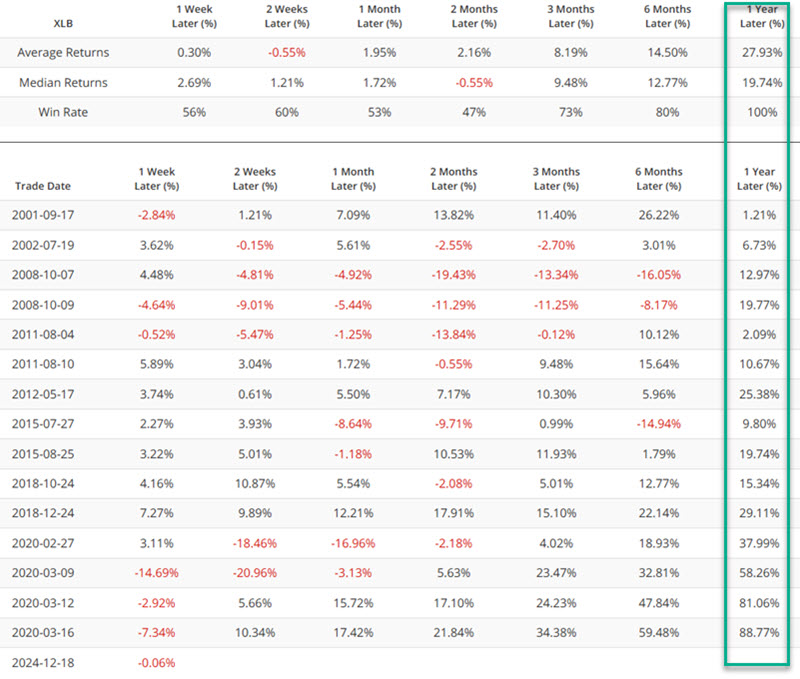
The twelve-month timeframe has shown a gain following all previous signals (NOTE: That does NOT guarantee that XLB will be higher by 2025-12-18, but it certainly lends bullish weight.
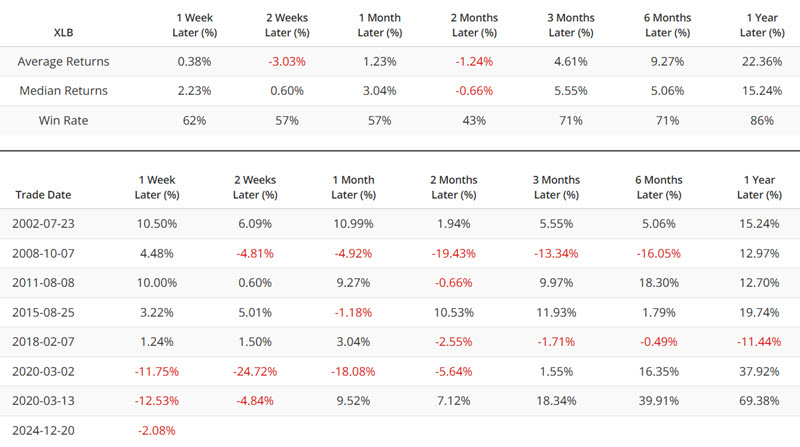
XLB 10-day sum Advance/Decline Ratio
The chart below highlights with a red dot each day when the XLB 10-Day Sum Advance/Decline Ratio crossed below 0.35, including overlapping signals. The most recent signal occurred on 2024-12-18.
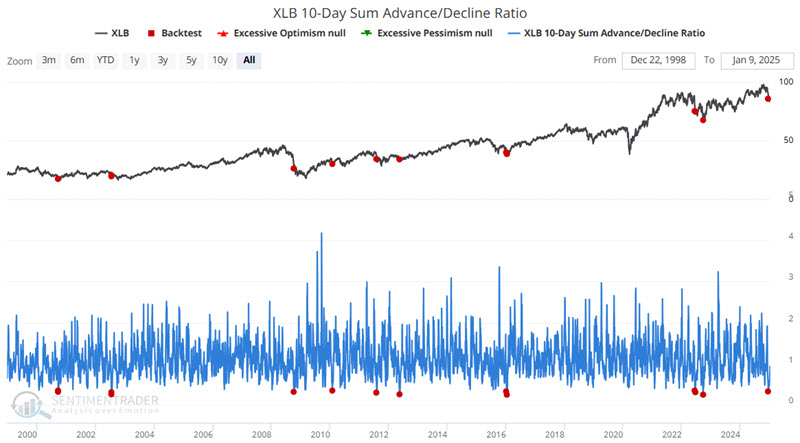
The table below displays signal-by-signal results for all signals since 1998 and summarizes XLB performance.
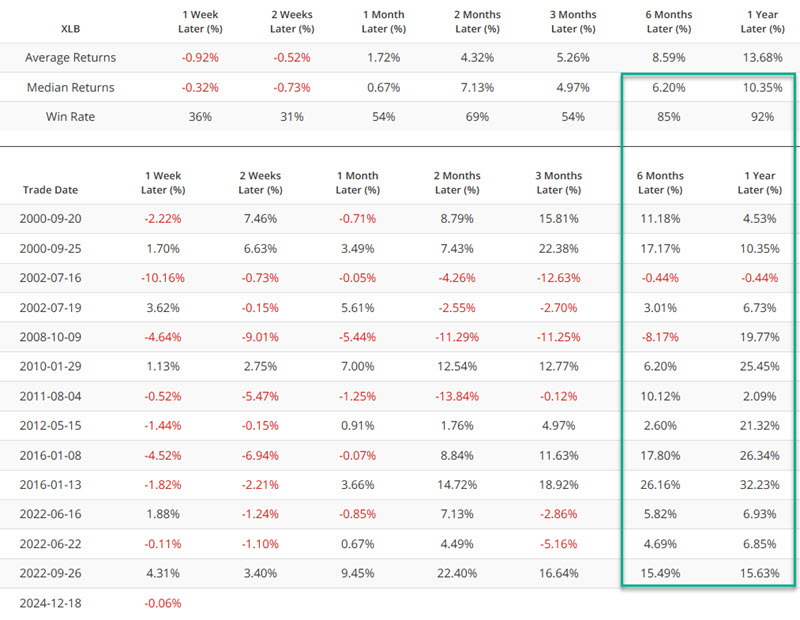
There was often some downside volatility during the first three months after a signal. However, six- and twelve-month returns were pretty consistent.
XLB 12 Week Low %
The chart below highlights with a red dot each day when the percentage of XLB stocks making a 12-week Low crosses above 70%. Like the other breadth indicators above, this tended to mark a time when the sector began to get washed out. The most recent signal occurred on 2024-12-19.
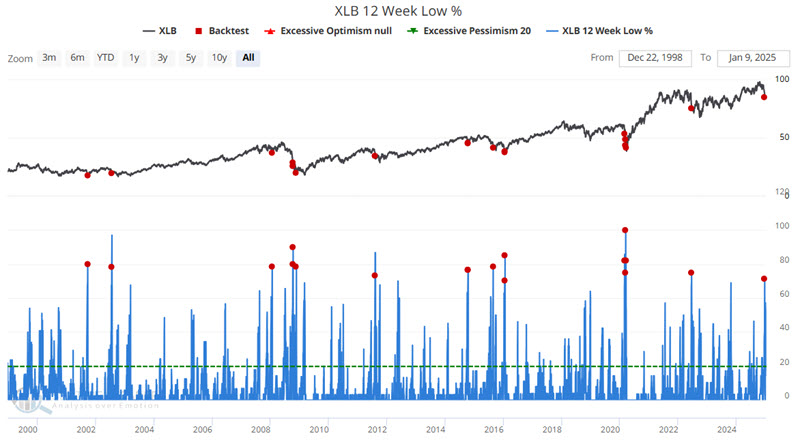
The table below displays signal-by-signal results for all signals since 1998 and summarizes XLB performance.
On several occasions, the first new signal fit the "trying to catch a falling safe" category as the market continued to decline - in some cases sharply - for a period before the ultimate bottom. This signal may best be used not as a "buy" signal but as a "start looking for a buying opportunity" signal.
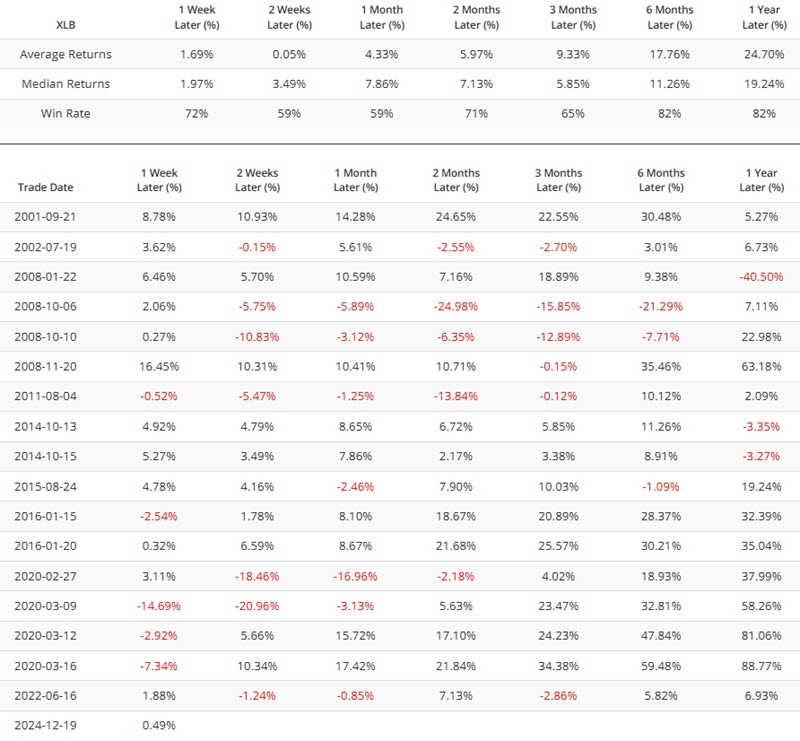
XLB 4 Week Low %
The chart below highlights with a red dot each day when the percentage of XLB stocks making a 4-week Low crosses below 95%. In other words, the value must first exceed 95% and decline below 95% for at least one day. The most recent signal occurred on 2024-12-20.
The table below displays signal-by-signal results for all signals since 1998 and summarizes XLB performance.
Note that the two-month win rate was only 43%, and the median return was negative. So, this is another signal that serves more as an alert than a trading signal.
XLB Breadth (%>10-day avg)
Let's add one more oversold breadth indicator to the mix. The chart below highlights with a red dot each day when the 10-day average of the percentage of XLB stocks trading above their 10-day moving average crossed below 5%. The most recent signals occurred on 2024-12-20 and again on 2024-12-27.
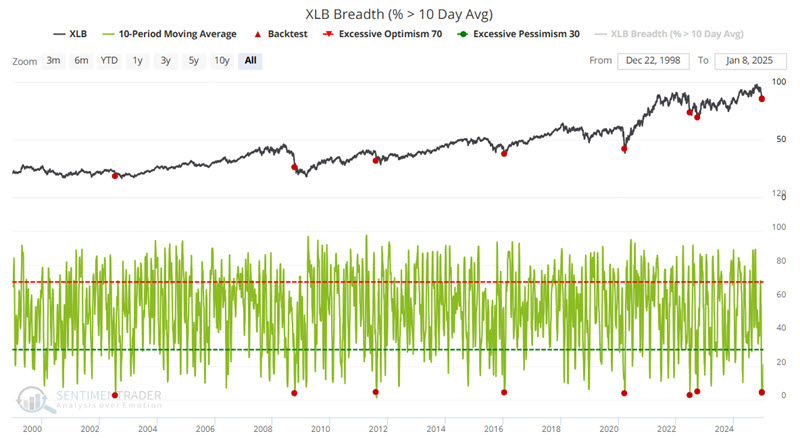
The table below displays signal-by-signal results for all signals since 1998 and summarizes XLB performance.
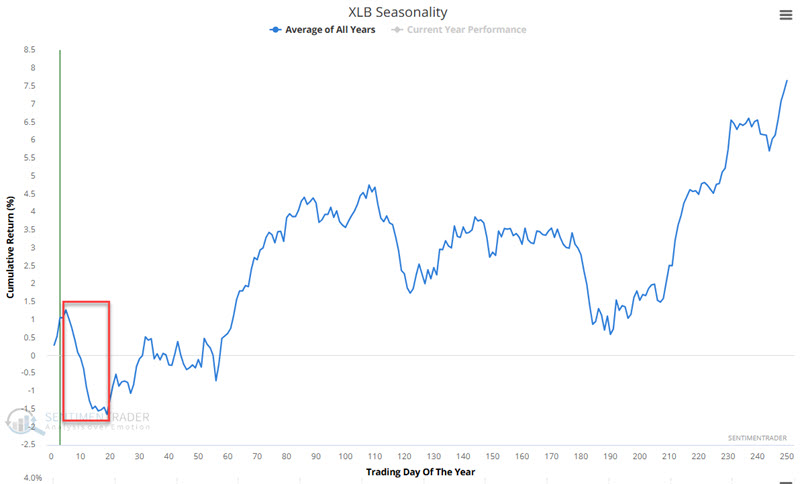
Seasonality suggests that patience is still in order
The chart below displays the annual seasonal trend for ticker XLB. Note the period of weakness from Trading Day of the Year (TDY) #5 through TDY #19. For 2025, this period extends from the close on 2025-01-08 through the close on 2025-01-29.
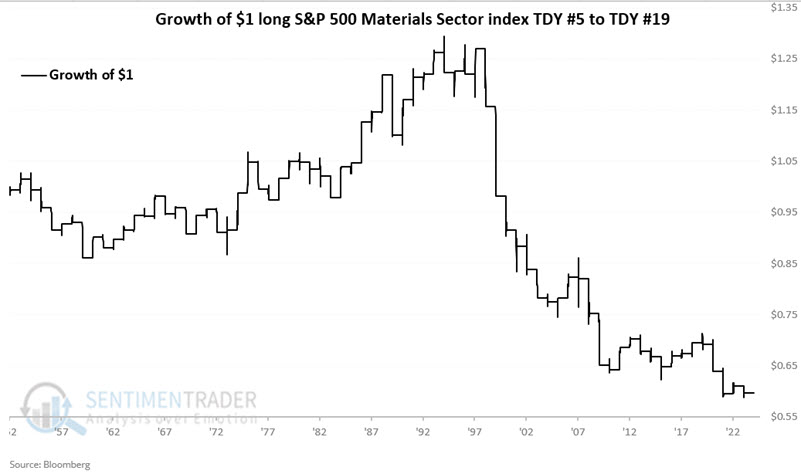
Ticker XLB tracks the S&P 500 Material Sector index. So, for testing, we looked at the performance of the index during this period every year since 1953. The chart below displays the hypothetical growth of $1 invested in the sector index from TDY #5 through TDY #19 every year.
The table below summarizes the results.
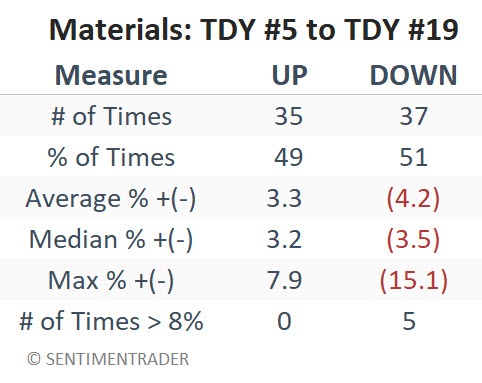
Overall, performance was decent for 40 years and then lousy for 30 years. There is no way to predict what XLB will do in January 2025. Still, the numbers above, combined with the recent absolute and relative weakness for XLB, suggest that a little more patience may be in order before making any meaningful commitment to this beaten-down sector.
What the research tells us…
Any security, commodity, or sector can always get "even more oversold." Sometimes, a longer-term bearish trend can experience a sharp selloff in the early going-which can be more of a "trap" than an "opportunity." However, when a sector experiences as many oversold signals as the Materials sector has recently, it typically offers a decent buying opportunity for longer-term investors. On that basis, it is time to have XLB on the radar. That said, investors might consider waiting for signs of an actual trend reversal before making any significant commitments.