
An Opportunity in Commodities

Key points:
- Led my metals, commodities have come out of the gate strong in 2026
- A typically favorable seasonal period for commodities begins soon and extends into mid-April
- Traders can gain exposure to a basket of commodities via one or more ETFs or ETNs
Commodities are off to a good start in 2026
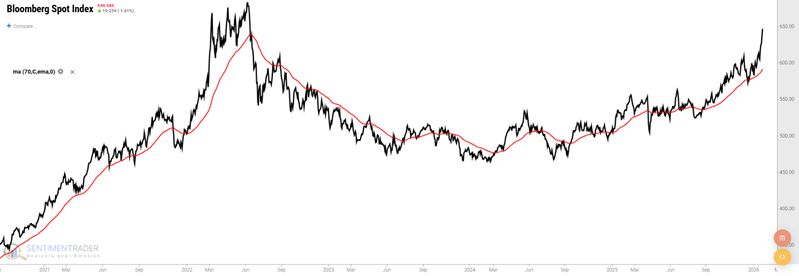
The Bloomberg Commodity Spot Price Index (BCOMSP) has gained more than 10% for the year through January 276th.
Many will attribute this strong performance to the huge run-up in metals early in 2026. However, they may not be entirely accurate. The iPath Bloomberg Commodity Index Total Return ETN (ticker: DJP) is designed to track the Bloomberg Commodity Index. I've included a breakdown of its recent holdings below.
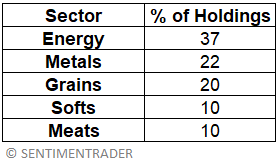
Note that metals make up only a little over 1/5th of the portfolio, and gold represents only 7.6% of the portfolio. The index is most heavily weighted toward energy, which finally started to show signs of life in January.
Where to from here? The last 50 years suggest a strong chance of more gains in the months ahead. Let's take a closer look at the history.
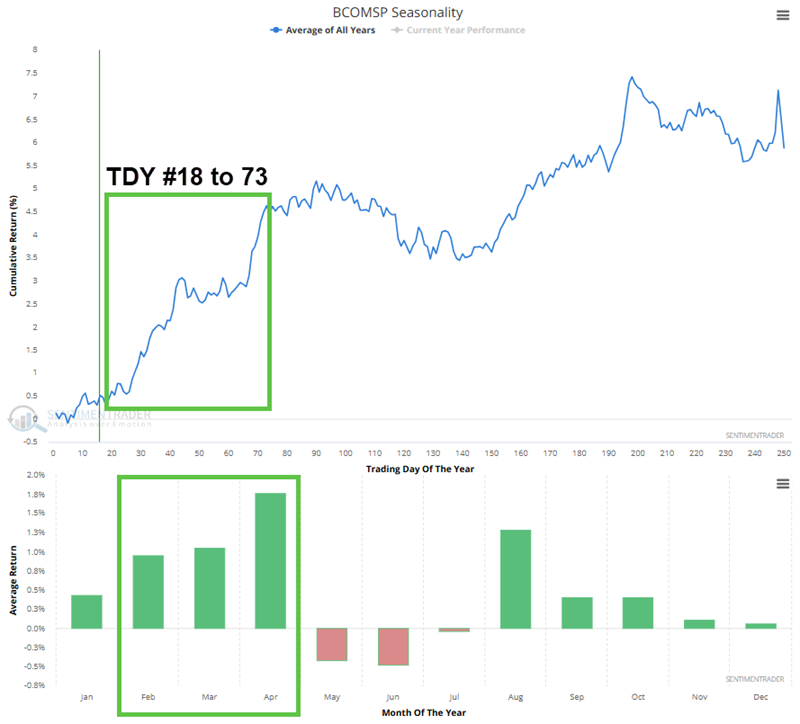
BCOMSP seasonality in late-winter, early-spring tends to be favorable
The chart below shows the annual seasonal trend for the Bloomberg Commodity Spot Price Index (BCOMSP). Note the tendency for favorable action between Trading Day of the Year (TDY) #18 and #73. For 2026, this period extends from the close on January 28th through April 17th. February, March, and April are some of the strongest months of the year.
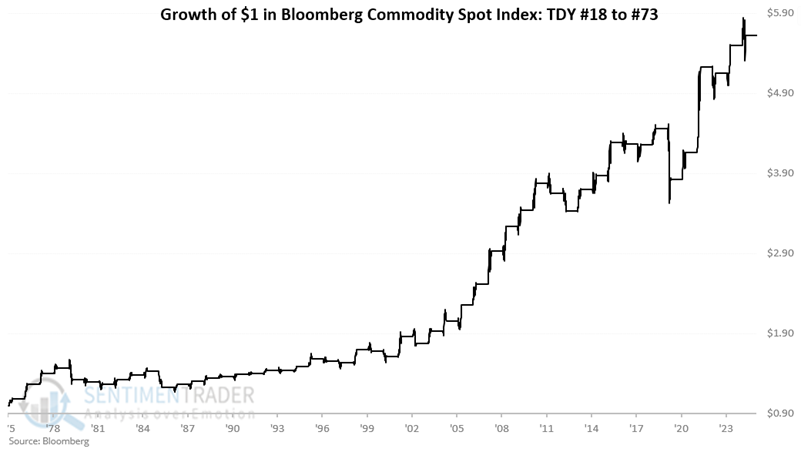
The chart below shows the hypothetical growth of $1 invested in BCOMSP only from TDY #18 through #73 over the last 50 years. The "lower left to upper right" nature of the results is apparent.
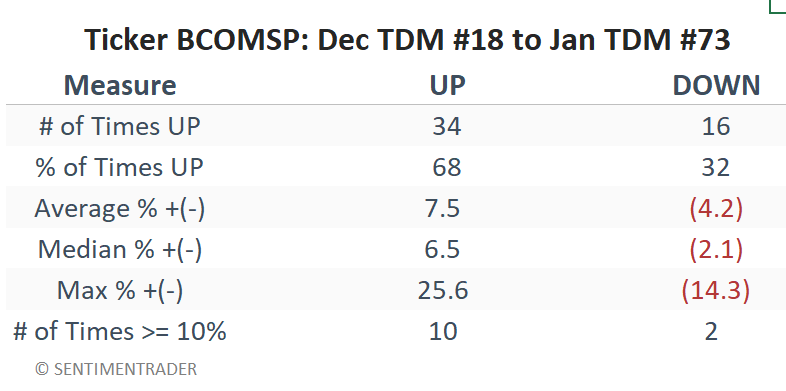
The table below summarizes BCOMSP performance during this period. While overall results are clearly favorable, it is essential to remember that a 68% win rate is pretty far from a "sure thing." So traders should think seriously about position sizing and if and where to place a stop-loss in case 2026 proves to be an off year for higher commodity prices moving into spring.
Choosing an investment vehicle
Before the advent of ETFs, a trader wishing to gain exposure to commodities as an asset class would need to either take long positions in a variety of futures contracts or buy shares of stocks that were considered "commodity-related." Now traders can instantly gain exposure to a basket of commodities by purchasing one or more commodity index-based ETFs or ETNs (exchange-traded notes).
The iPath Bloomberg Commodity Index Total Return ETN (ticker: DJP) is designed to track the Bloomberg Commodity Index, making it a sound choice. That said, it should be noted that DJP is an exchange-traded note (ETN) and not an ETF. In theory, there is credit risk as an ETN is essentially a debt security of the issuing company - in this case, Barclays Bank PLC - and not an actual exchange-traded fund (ETF). Likewise, DJP tends to have significantly lighter trading volume than many other commodity-related index securities.
Some of the more well-known and actively traded commodity ETFs are listed below.
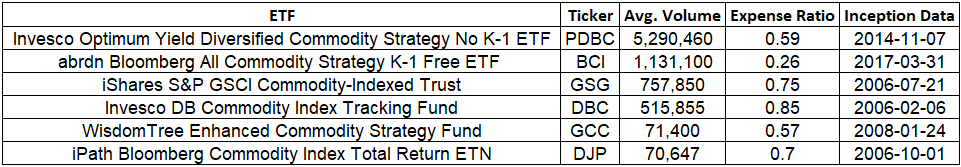
Note that tickers GCC and BCI have been leading performers among this group in recent months (although there is no guarantee that that trend will continue.
Price action is in agreement with seasonality
In the first chart in this note, we saw that recent price action for BCOMSP has been very strong of late and is trading above its 70-day exponential moving average. While waiting for a slightly less overbought situation to appear before jumping in might make sense, the bottom line is that seasonality and price action are in bullish alignment. This configuration often presents an opportunity for traders willing to accept a certain level of risk.
What the research tells us…
Commodities as an asset class have tended to show strength during the late-winter, early-spring period. With price action trending higher, an opportunity is forming for traders to play the long side of the commodities market. ETFs and ETNs offer traders a way to gain exposure to a broad basket of commodities, just as they would buy shares of stocks, without having to take on the leverage involved in trading commodity futures contracts.