
An objective approach to "Sell in May" - Part II

NOTE: Due to a scanning error, the year-by-year table in the emailed version of Part I inadvertently omitted the years 1978 to 1987. The table in the online version of Part I has been corrected. The numbers in the summary table were not affected and are correct.
Key points
- In Part I, we established that there is some correlation between how the stock market performs during the first four months of the year and how it performs from May through October
- In Part II, we will add a price trend factor to the mix
- When both factors are unfavorable, the probability of a meaningful stock market advance is well below average
What we know so far
In Part I, we established that since 1950:
- The stock market has performed much better during November through April than during May through October
- $1 invested in the S&P 500 only in November through April grew 11,756% to $118.56
- $1 invested in the S&P 500 only from May through October grew 186.7% to $2.88
- If the worst year-to-date decline through April for the S&P 500 did not exceed -4%, the S&P showed a May through October gain 83% of the time
- If the worst year-to-date decline through April for the S&P 500 was -4% or worse, the S&P showed a May through October gain 44% of the time
- $1 invested in SPX during May through October only during years when the worst year-to-date decline through April did not exceed -4% grew 467.1% to $5.67
- $1 invested in SPX during May through October only during years when the worst year-to-date decline through April was -4% or greater declined by -49% to $0.51
Adding in a price trend factor
For our test, we will add a one-year moving average (252 trading days to be specific).
A = Today's close for the S&P 500
B = 252-day moving average of S&P 500 daily closes
C = A - B
The question is "Is the S&P 500 above or below its 1-year average?"
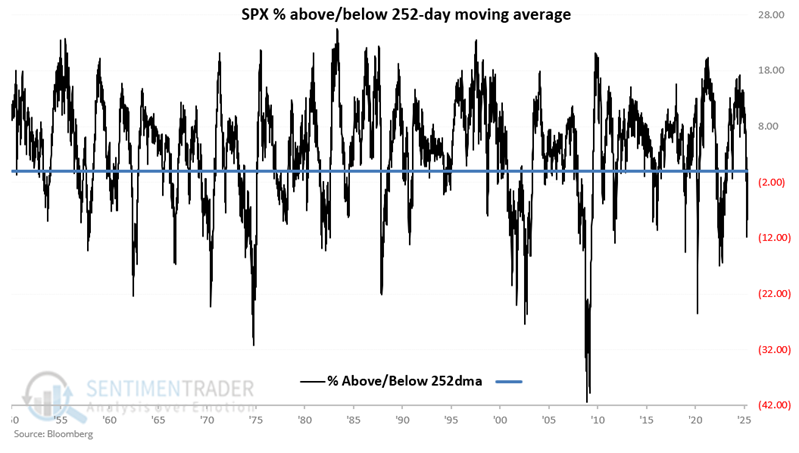
The chart below shows a slightly different version using percentages as follows:
((A / B) - 1) *100
This shows that the percentage of the S&P 500 has been above or below its 252-day average each day since 1950.
Adding trend to the 4% sell in May model
So here are the inputs for a simple Sell in May model.
A = Today's close for the S&P 500
B = 252-day moving average of S&P 500 daily closes
C = A - B
If C >= 0 then Variable D = +1 else Variable D = 0
Variable E:
- If the S&P 500 did not experience a year-to-date loss of -4% or more through the end of April, then during May through October, Variable E = +2
- If the S&P 500 DID experience a year-to-date loss of -4% or more through the end of April, then during May through October Variable E = -2
- Otherwise Variable E = 0 (in other words, from November 1st through April 30th, Variable E = 0. Between May 1st and October 31st, Variable E is either +2 or -2, depending on whether the S&P 500 is above or below its 252-day moving average)
Variable F = D + E
For example, as of 2025-05-09:
A = 5,659.91
B = 5,679.64
C = (-19.73)
D = 0 (equal to 0 because Variable C is negative)
E = -2 (equal to -2 because SPX showed a greater than -4% YTD loss before the end of April)
F = 0 + (-2), so Variable F = -2
We can refer to Variable F as the "Sell in May Model."
To summarize:
- IF today is between May 1st and October 31st
- AND the S&P 500 experienced a maximum loss of -4% or more at any point during the first four months of the year, AND
- AND the S&P 500 closed yesterday below its 252-day moving average
- Then Variable F = -2 (i.e., this model is unfavorable for stocks)
Under any other circumstance, Variable F is > -2 (i.e., this model is favorable for stocks)
Where we stand now
Note that the Sell in May Model (i.e., Variable F) flipped from unfavorable to favorable after the close on 2025-05-12.
After the close on 2025-05-09:
- Variable D = 0 (because SPX < 252-day moving average)
- Variable E = -2 (because 1st four months worst close < -4%)
- Variable F = -2 (D + E)
However, on 2025-05-12, the S&P 500 closed back above its 252-day moving average. As a result:
- Variable D = +1 (because SPX > 252-day moving average)
- Variable E = -2 (because 1st four months worst close < -4%)
- Variable F = -1 (D + E)
In other words, by moving back above -2, the model has gone from unfavorable to favorable. Note that if the S&P 500 sinks from its current level and drops back below its 252-day average, the model could easily flip back to unfavorable.
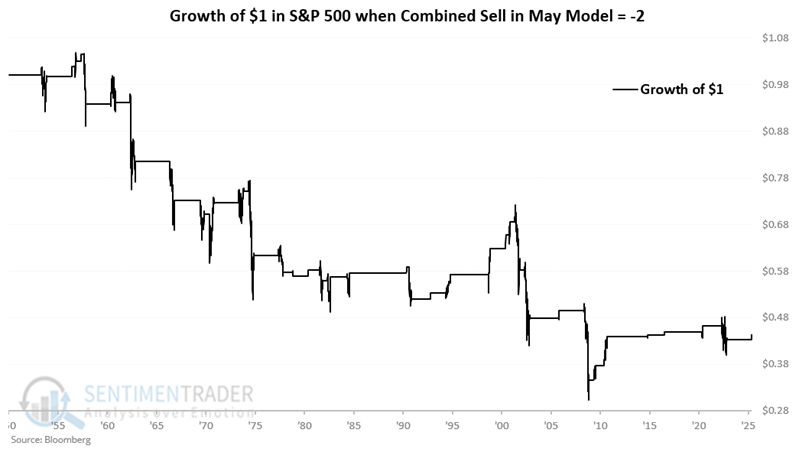
Why might any of this matter? The chart below displays the hypothetical growth of $1 held in the S&P 500 only if the previous day's value for F was -2. From 1949-12-31 through 2025-05-09, $1 invested in the S&P 500 Index only when Variable F = -2 declined by 56% to $0.44.
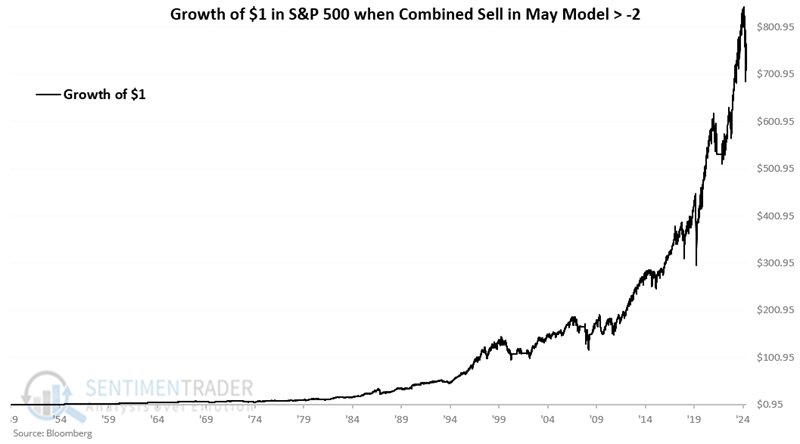
Conversely, the chart below displays the hypothetical growth of $1 invested in the S&P 500 only when Variable F is NOT -2.
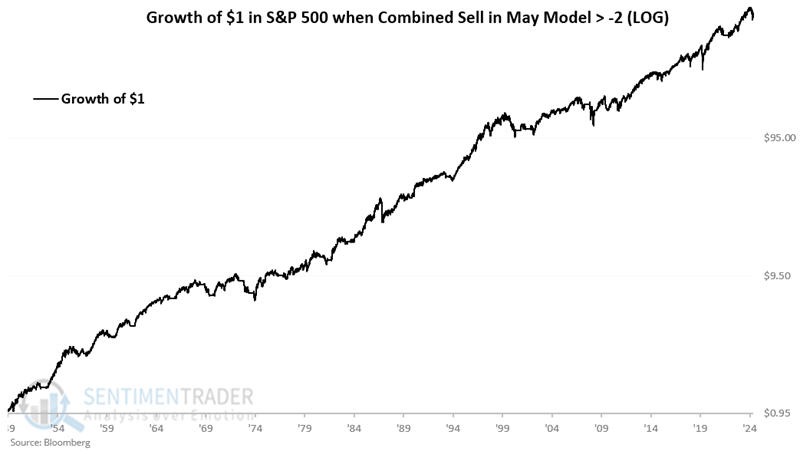
The chart below shows the same results as the chart above on a logarithmic scale.
For the record, the hypothetical growth of $1 from 1950 to May 2025:
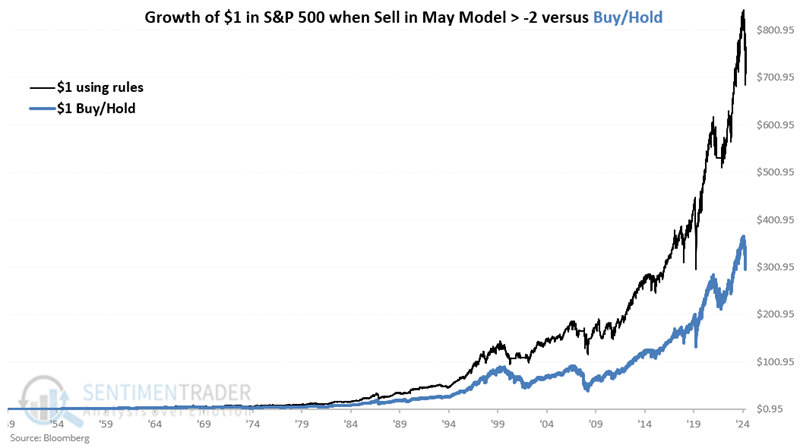
- While Variable F > -2 = $1 grew to $760.52
- While Variable F = -2 = $1 declined to $0.44
- Buying and holding SPX = $ grew to $337.10
The chart below displays the hypothetical growth of $1 using the rules above (i.e., ONLY being out of stocks when Variable F = -2) versus buying and holding the S&P 500.
So does the Sell in May Model move above -2 on 2025-05-12 "guarantee" smooth sailing from here? Not at all. Remember that if SPX closes below its 252-day moving average (which it could easily do), the model will return to an unfavorable -2 reading.
What the research tells us…
As configured here, this model is primarily useful to investors who prefer to be mostly fully invested (remember, this model is always fully invested in SPX from November 1st through April 30th the following year). The model will only be out of stocks if January through April experienced some weakness along the way (i.e., a -4% or more loss anytime during the first four months) AND the market is currently experiencing weakness (SPX below its 252-day average) only during the months of May through October. Note that there is a potential for "whipsaws" whereby the S&P 500 flits above and below its 252-day moving average.
The S&P 500 registered a maximum closing loss of -15.3% during the first four months of 2025. As a result, Variable E = -2. However, at the close on 2025-05-12, the S&P 500 closed back above its 252-day moving average. Therefore, Variable D is +1. The net result is that Variable F = -1. Based on the rules above, any reading other than -2 is considered favorable for stocks. As long as the S&P 500 holds above its 252-day moving average, any "Sell in May" concerns are moot.